Advanced PMax Channel Report
Google cracked open the black box — we built the dashboard to explore it.
This script
helps with:
Easier to understand channel dynamics
Faster access to
key KPIs
See your data from new, strategic angles
PMax channel data made digestible, by design
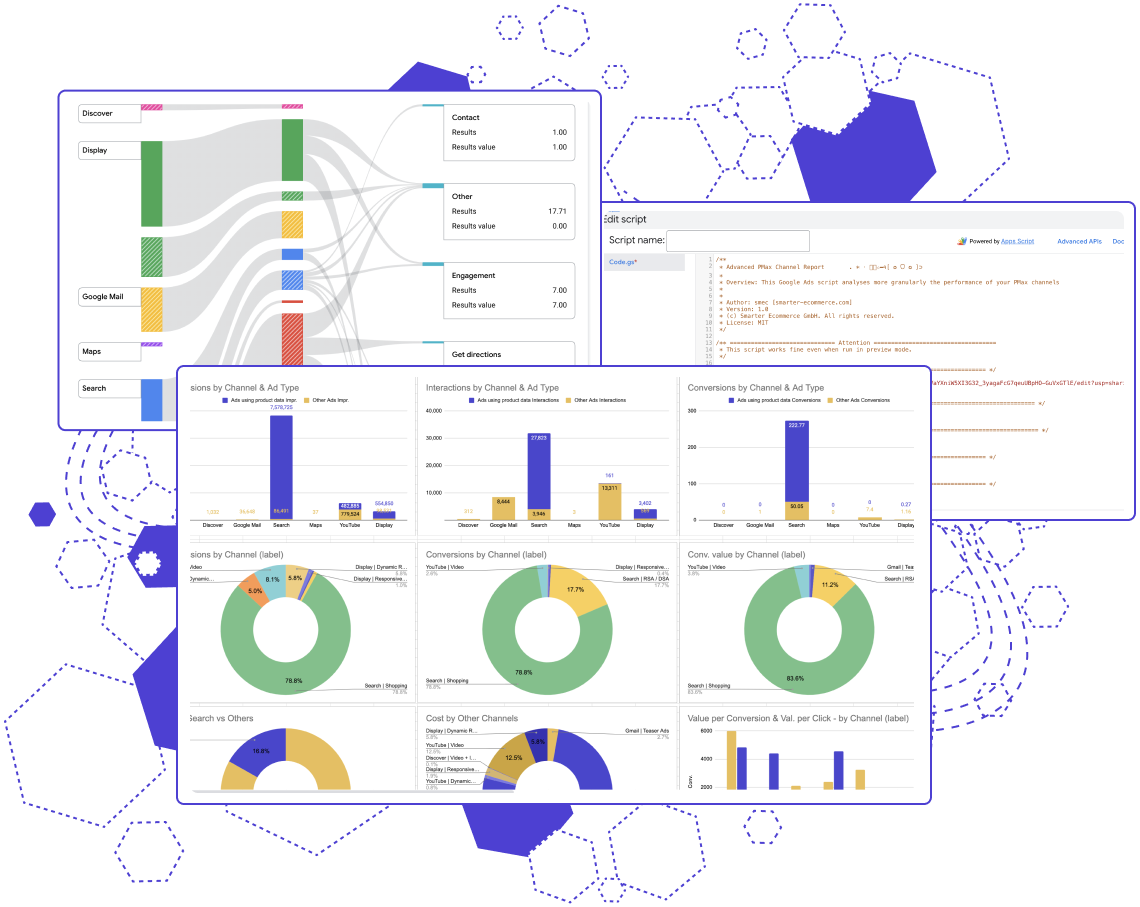
Google’s new Channel Performance report finally sheds light on how your PMax campaigns distribute across networks. While a great step forward, the metrics are limited, and making sense of it all takes more time than it should.
That’s where our script comes in. Drop in an export Sheet URL and instantly transform the raw data into a visual, easy-to-navigate dashboard. Get calculated KPIs, clear comparisons, and actionable views — no coding, no spreadsheet wizardry required.
A dashboard built for clarity
Say goodbye to messy spreadsheets and manual number crunching. Our script transforms your Channel Performance report into a clean, navigable dashboard — all within Google Sheets.
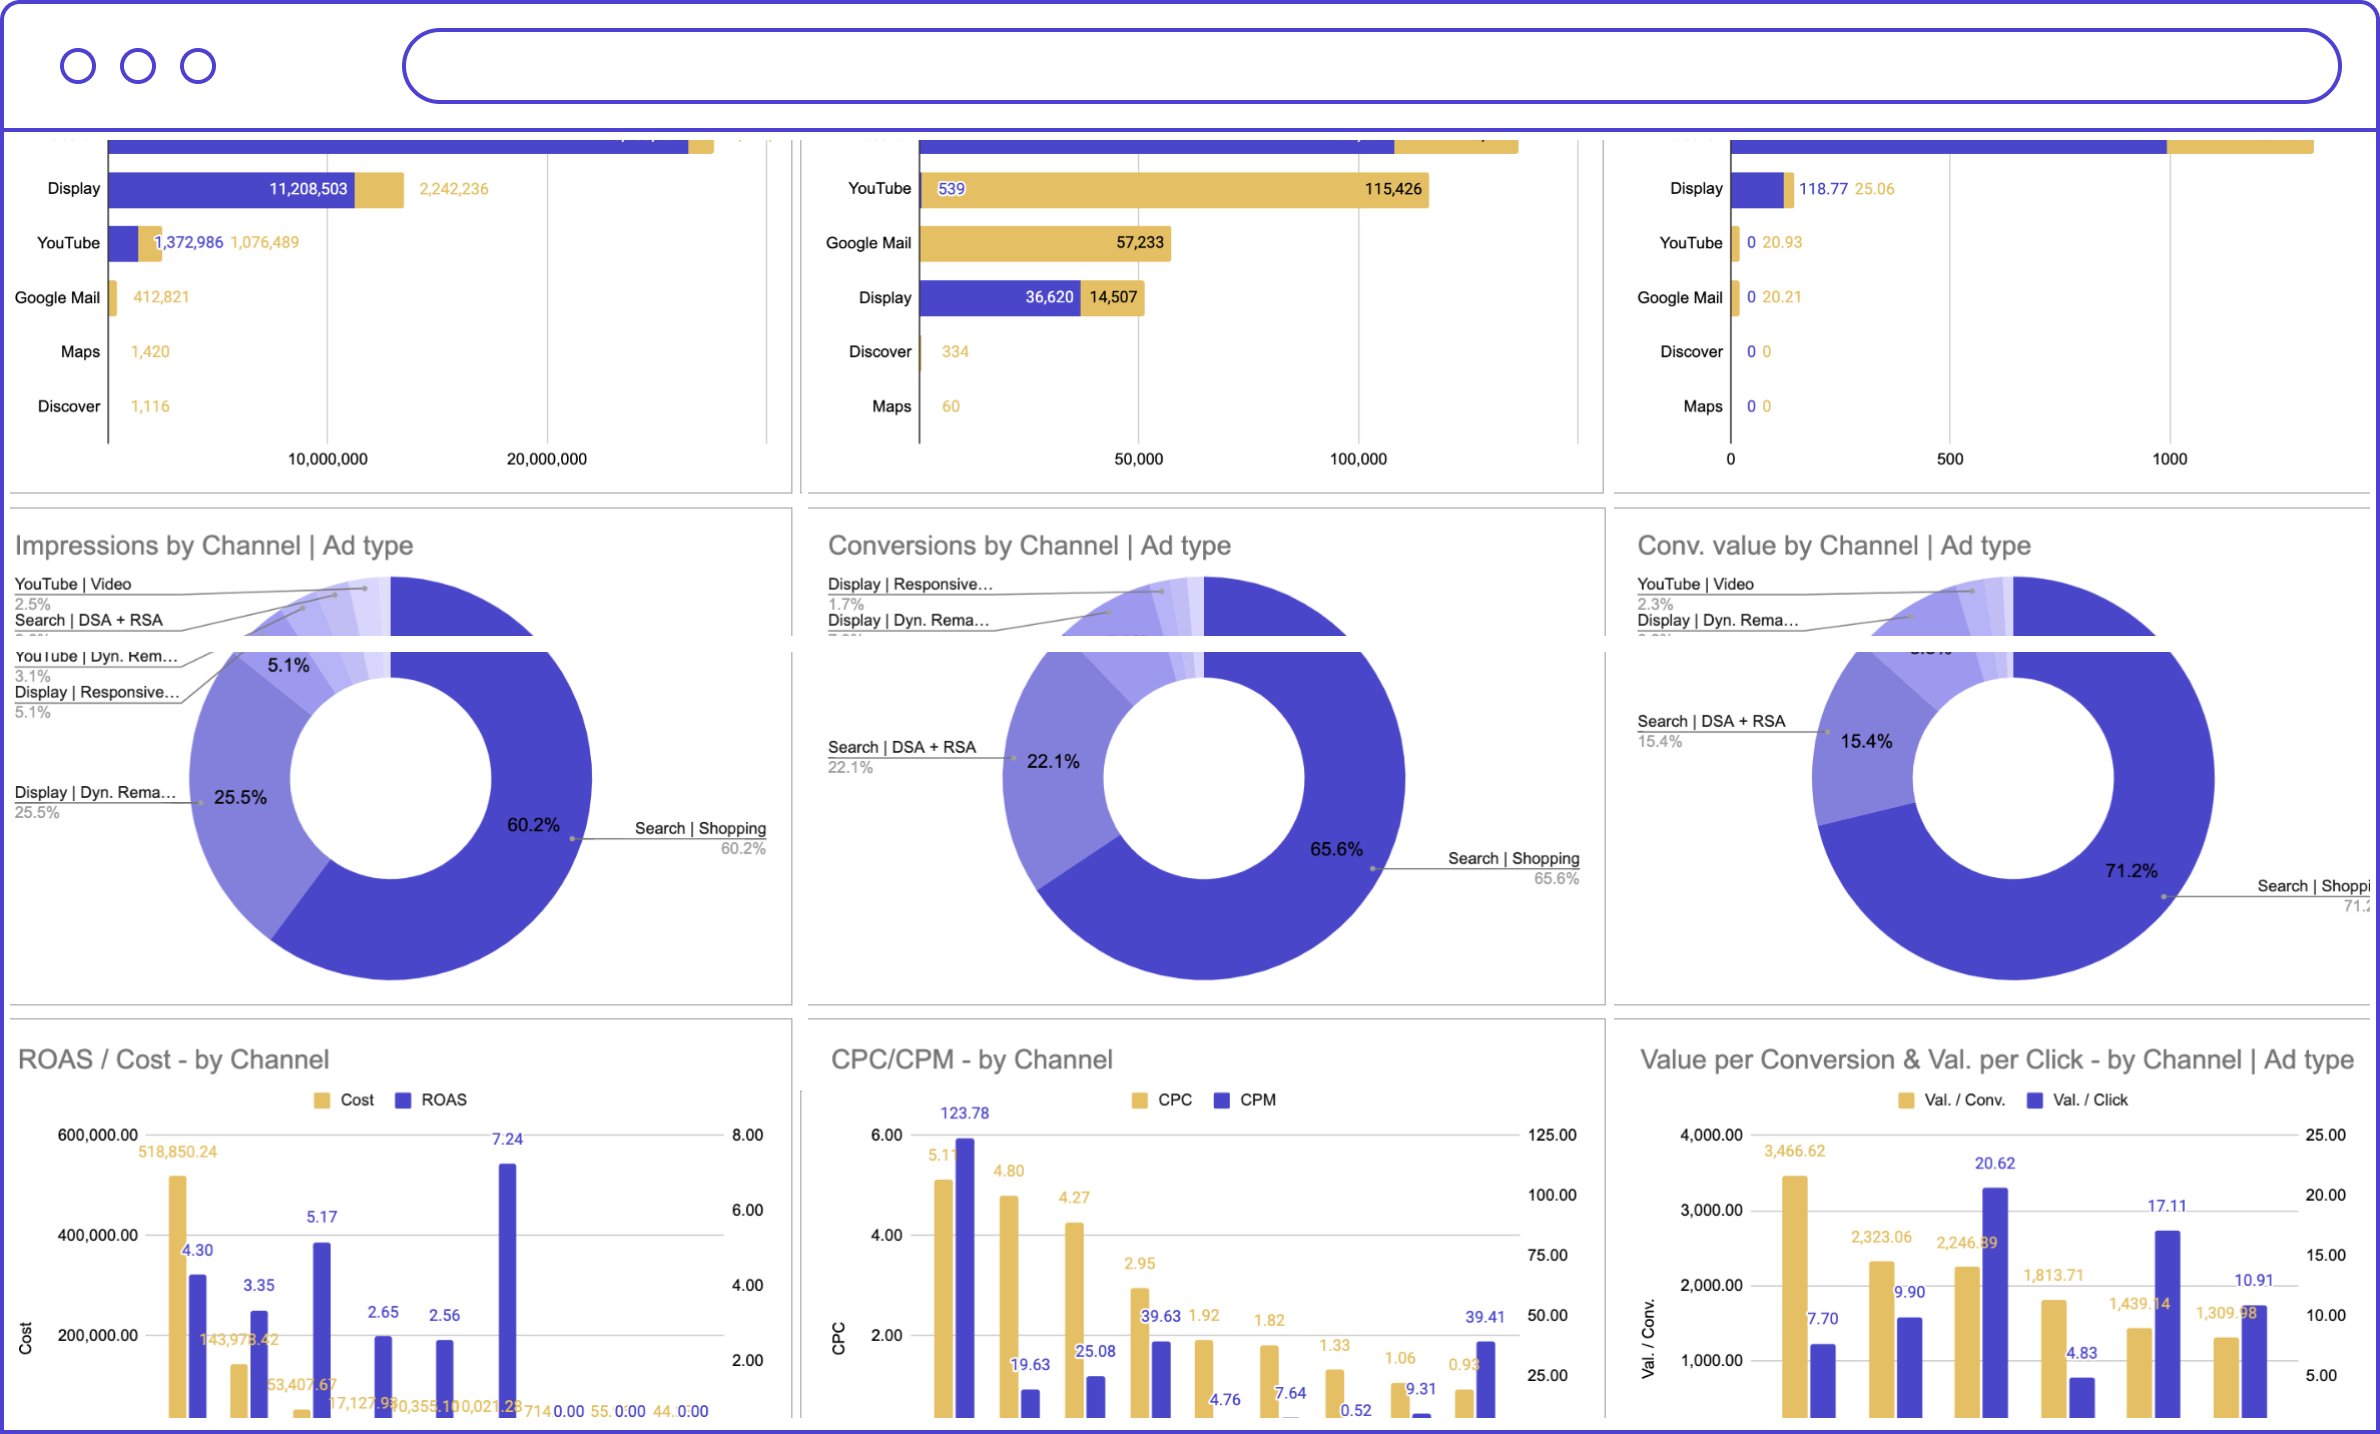
No macros, no complex templates — just drop in your export, and the sheet does the rest. You'll get calculated KPIs like ROAS, CPC, CPE, Val./ Conv. per channel. You can expect charts that actually help you spot what matters.
New angles
to guide your next move
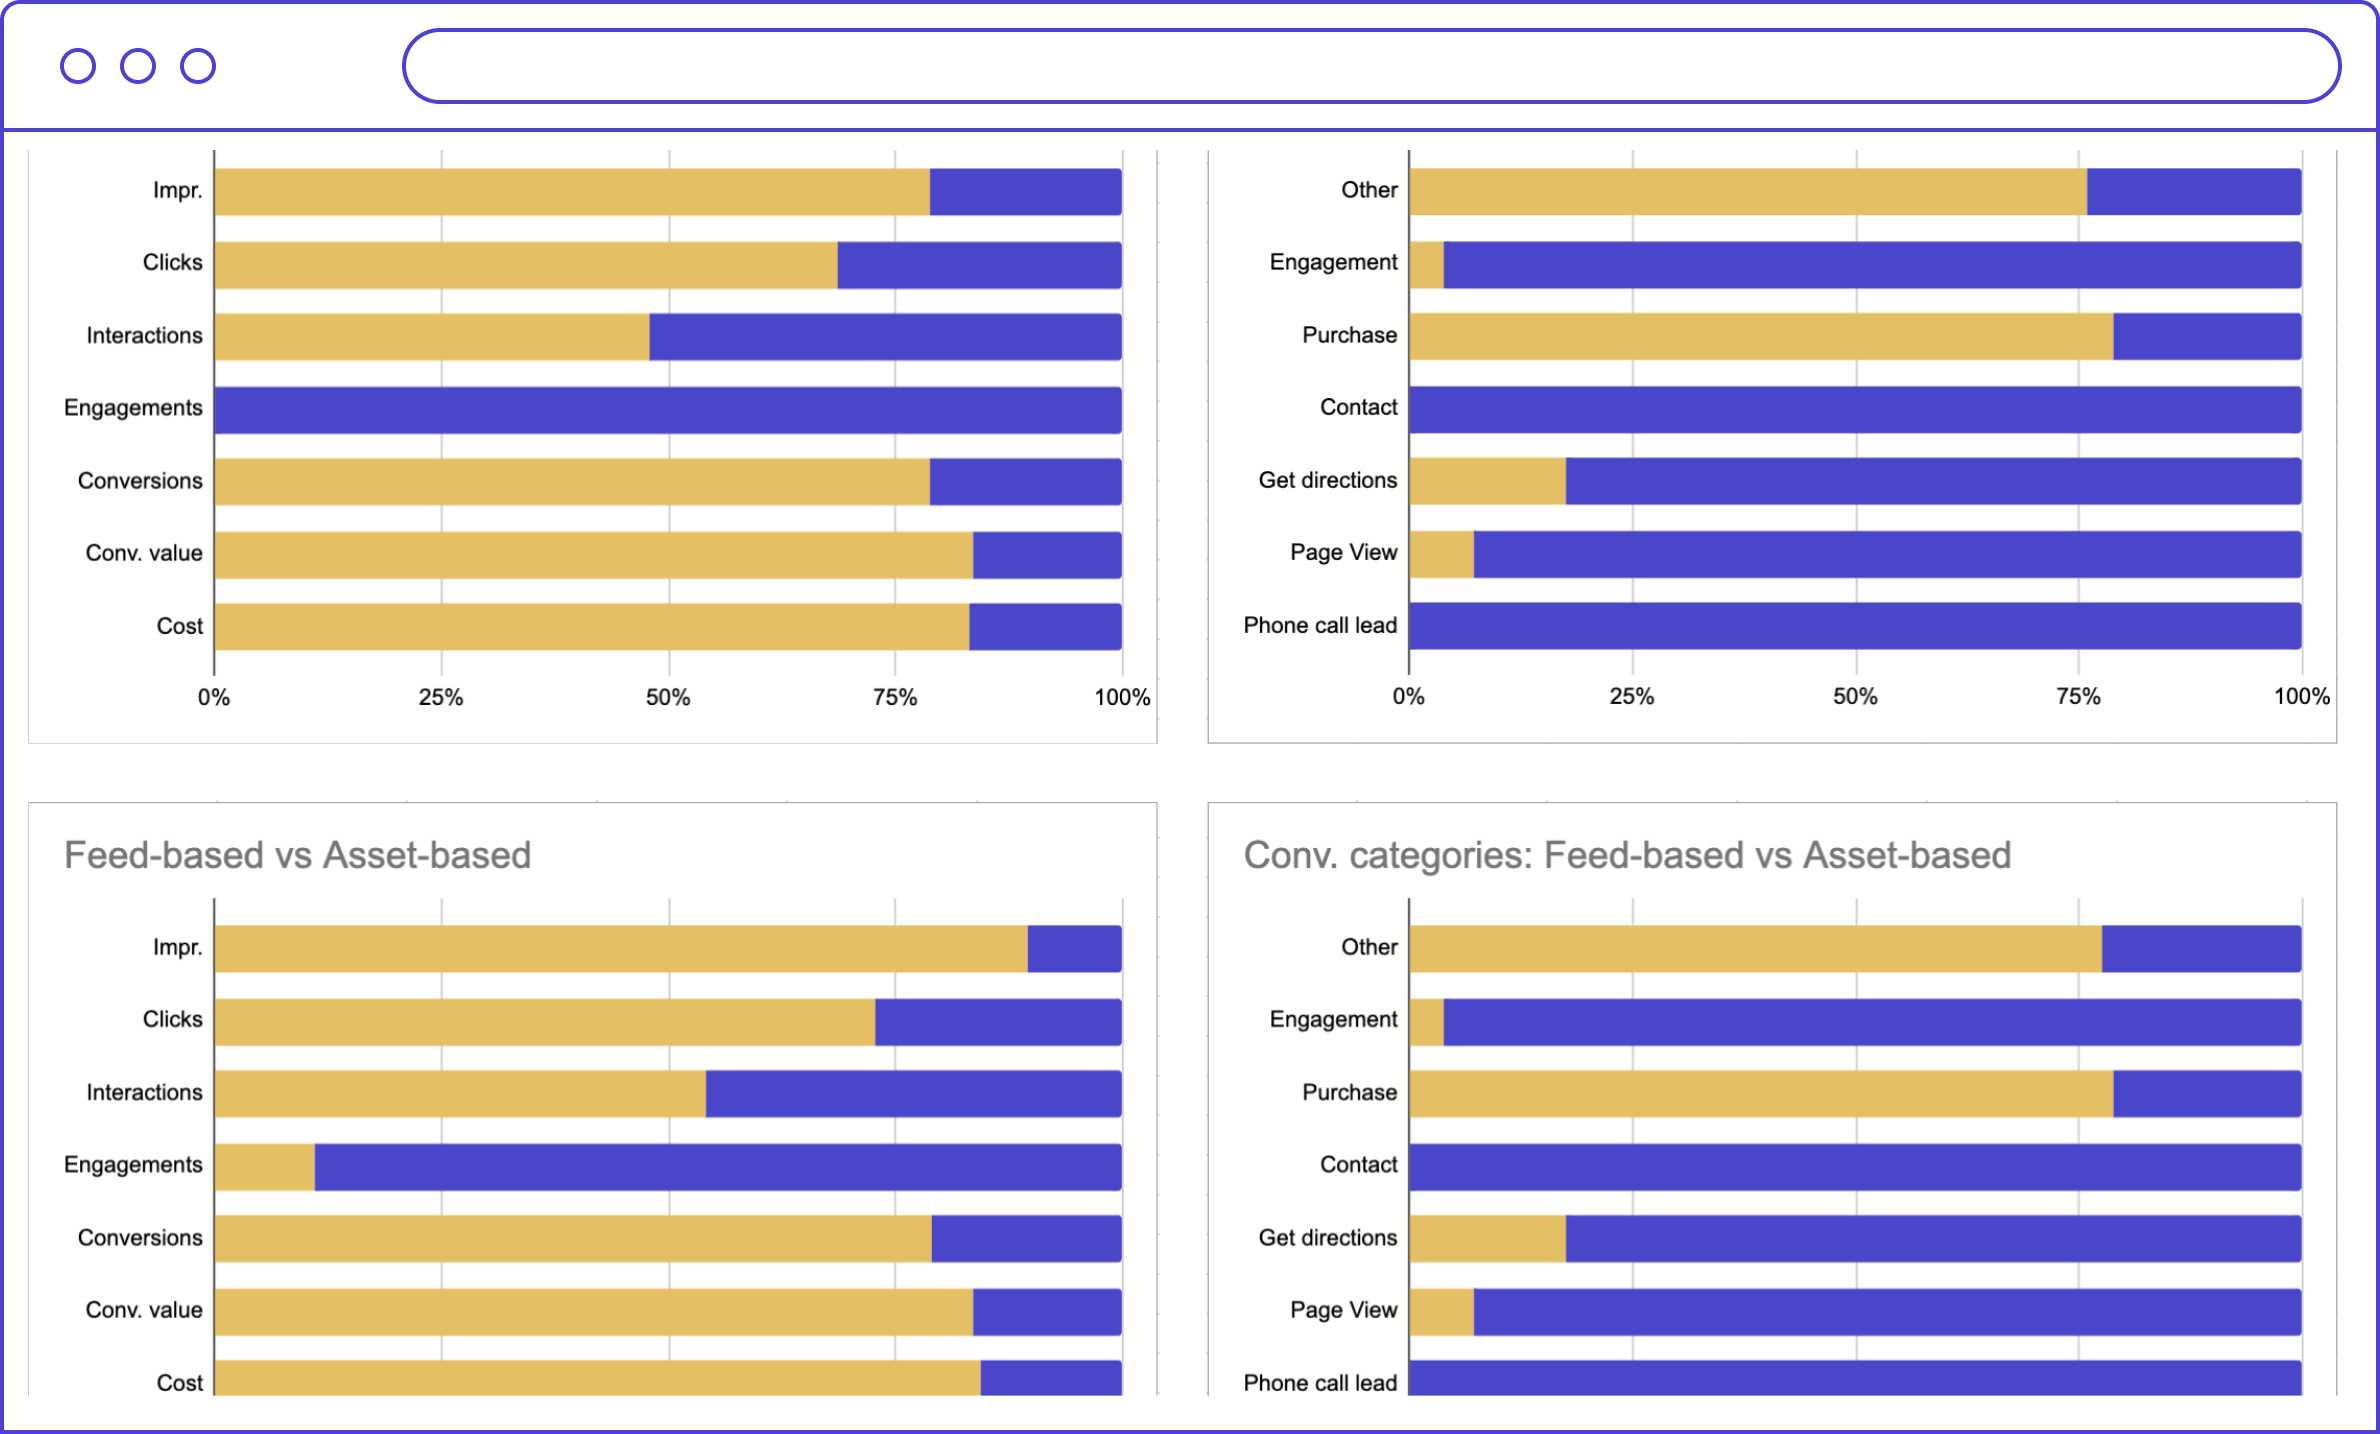
See your PMax data from perspectives that go beyond the basics. Additional dashboards break down performance by Shopping vs Other channels and Feed-based vs Asset-based activity — letting you compare impact, efficiency, and strategy at a glance.
These views uncover trends that the default export buries. Whether you want to evaluate asset-heavy campaigns or spot how Shopping drives results versus Display or YouTube — it's all there, clean and ready to act on.
See it in action
Watch this short walkthrough to learn how the script works — from downloading your report to turning it into a fully visualized dashboard in Google Sheets. No guesswork, no manual cleanup.
🎬 It’s a 3-minute setup guide
💡 Note: This script works best on campaigns with an ecommerce focus (ones with a product feed).
Get the script and unlock smarter PMax insights
Just leave your email below and unlock the script.
You'll find the script on-page
We take your privacy seriously. Read our privacy policy.
Get your script code below:
The code was successfully copied to your Clipboard.
Still unsure?
Here’s how to use the script in 3 easy steps
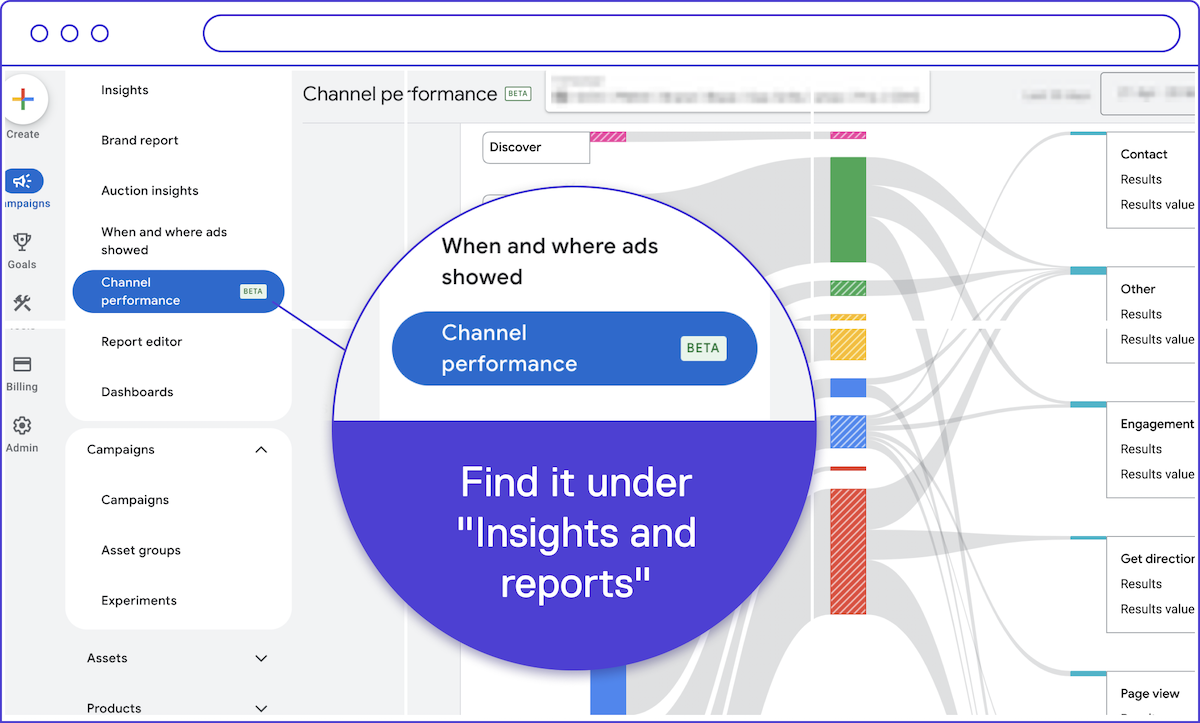
1. Open your “Channel Performance” report section
Head to your Google Ads UI, choose a specific PMax campaign, and navigate to the “Channel Performance” section under Insights & Reports.
⚠️ Note: This script can analyze only data at the campaign level. You need to navigate to a specific PMax campaign you want to analyze. The script currently works only with English-language Google Ads UIs. Using a different setup? Switch to English language and US number format.
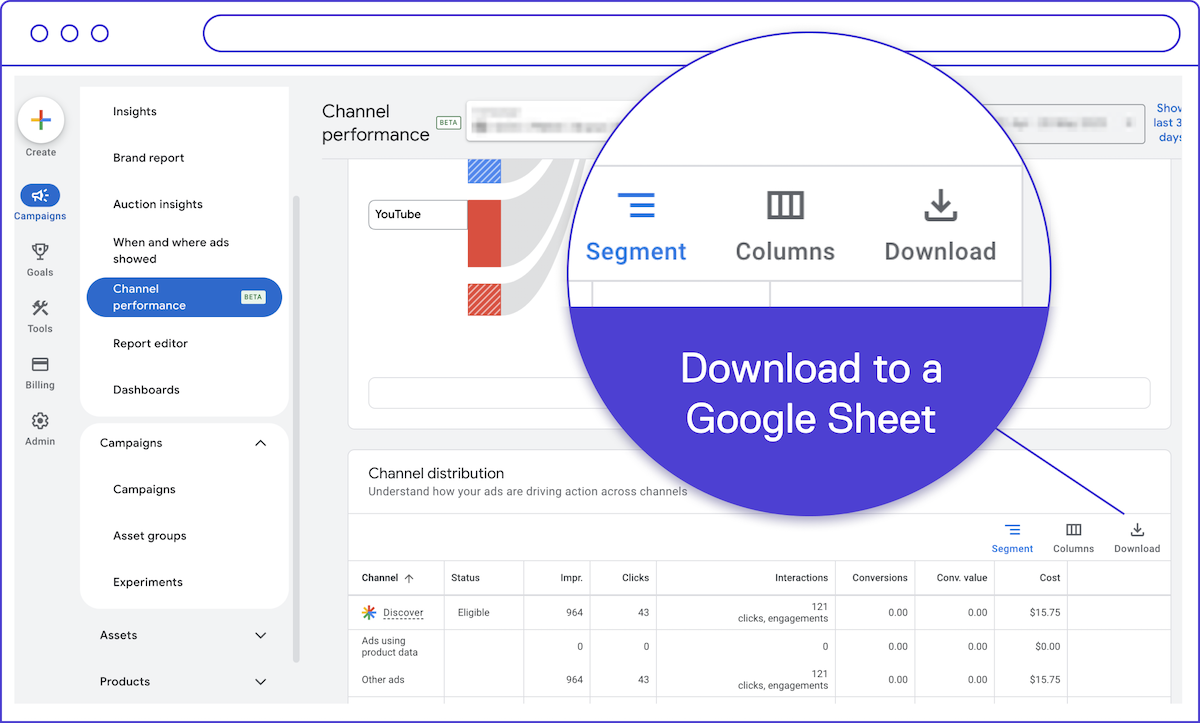
2. Download the report as a Google Sheet
Scroll to the table view of your “Channel Performance” data. Use the download option and select Google Sheets as your format. You'll need the URL of this sheet on the next step.
Make sure the account running the script later has Edit access to that Google Sheet.
💡 Reminder: Use the date picker and make sure you selected the right time period you'd like to examine.
3. Run the script using your Sheet URL
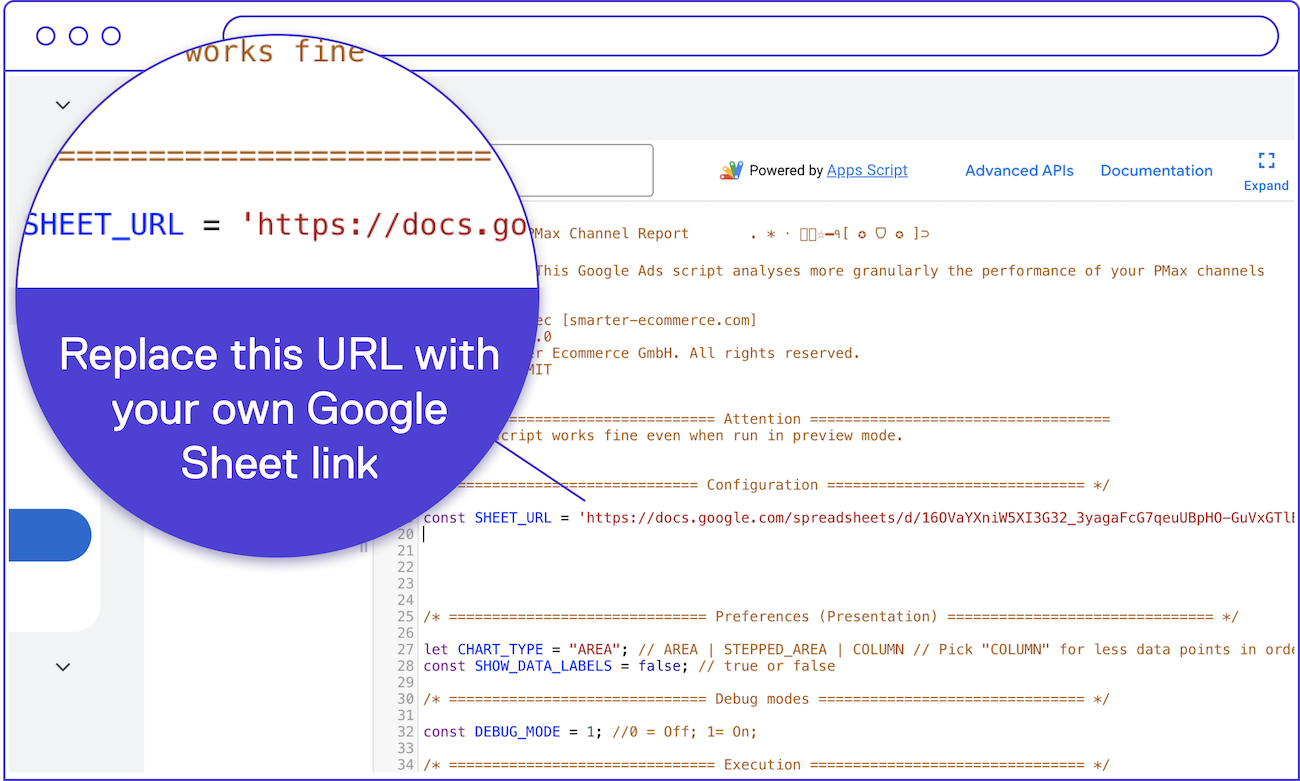
In your Google Ads account, go to Tools → Bulk actions → Scripts, and create a new script. Delete the placeholder code. Then copy and paste the code from this page, once you register.
Next, look for this line in the code: const SHEET_URL = "https://...";
Replace the sample URL with the actual Google Sheets link you just exported.
That’s it — run the script, and it will write your enhanced dashboard right into the same Sheet.
Important: Google may change the structure of the report that this script relies on. This can cause the script output to break or show incorrect values. Always cross-check the results with the original Google Ads report, and refer to this page for the latest version of the script.