Google Ads Ecommerce Benchmarks: Q1 2026 Report
Analyzing over €650M in European ad spend across Search, Shopping, and PMax to reveal where performance is heading.
Impression share of Amazon, Temu, eBay & AliExpress for Q1 2026
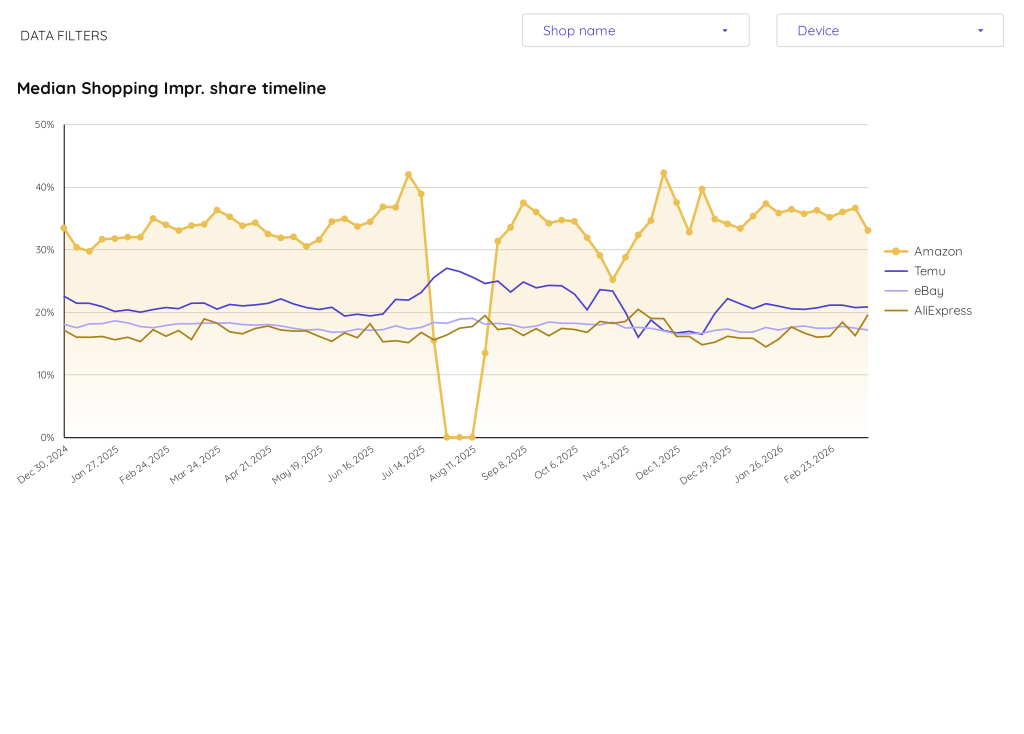
Overall Trends The Q1 2026 Median Shopping Impression Share data indicates a market-wide stabilization following a highly volatile Q4 2025. Secondary competitors eBay and AliExpress maintained flat trajectories across both quarters, with eBay hovering tightly at ~17-18% and AliExpress fluctuating slightly between 15% and 19%. Temu saw its impression share narrow from a volatile Q4 range of 16%-24% to a stabilized ~20%-21% throughout Q1 2026.
Biggest Mover: Amazon Amazon is the biggest mover, characterized by a dramatic shift from extreme Q4 volatility to Q1 stability. During Q4 2025, Amazon’s impression share experienced severe swings, plummeting to a low of ~25% in early November before surging to a peak of ~42% by early December.
Entering Q1 2026, this erratic movement ceased entirely. Amazon consolidated its market dominance, maintaining a tight, stable impression share between 34% and 37% from late December through February 2026. This Quarter-over-Quarter shift highlights a transition from aggressive, fluctuating holiday-season bidding dynamics in Q4 to a sustained, normalized baseline in Q1.
Google Ads CPC Dynamics: European E-commerce (Q1 2026)
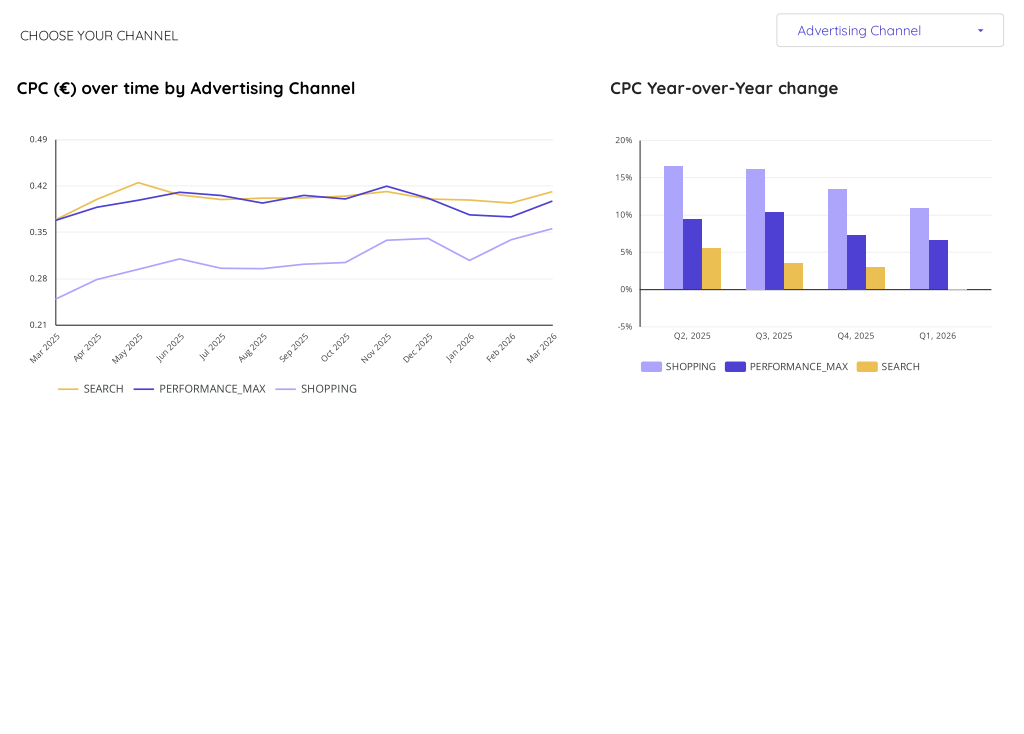
Q1 2026 vs. Q4 2025 CPC Analysis
Biggest Mover: Performance Max Performance Max exhibited the most significant Quarter-over-Quarter (QoQ) shift, presenting a positive signal for ecommerce retailers. After peaking at €0.42 in November 2025, CPCs dropped sharply to €0.37 in January and February 2026 before recovering to €0.40 in March. Furthermore, its Year-over-Year (YoY) CPC growth decelerated from ~7.5% in Q4 2025 to ~6.5% in Q1 2026, indicating cooling costs.
Shopping Shopping CPCs displayed volatility with a negative late-quarter trend. While costs dropped from €0.34 in December 2025 to €0.31 in January 2026, they surged to a period-high of €0.35 by March 2026. This rising intra-quarter CPC is a negative signal for retailer profitability. Despite this QoQ increase, Shopping’s YoY growth rate cooled slightly from ~13.5% in Q4 to ~11% in Q1, though it remains the fastest-inflating channel.
Search Search remained the most stable but expensive channel, hovering tightly between €0.39 and €0.41 across both quarters. However, a highly positive signal for retailers is its YoY growth rate: Search CPC inflation completely flattened to 0% in Q1 2026, down from ~3% in Q4 2025.
Google Ads Clicks and Impressions Dynamics: European E-commerce (Q1 2026)
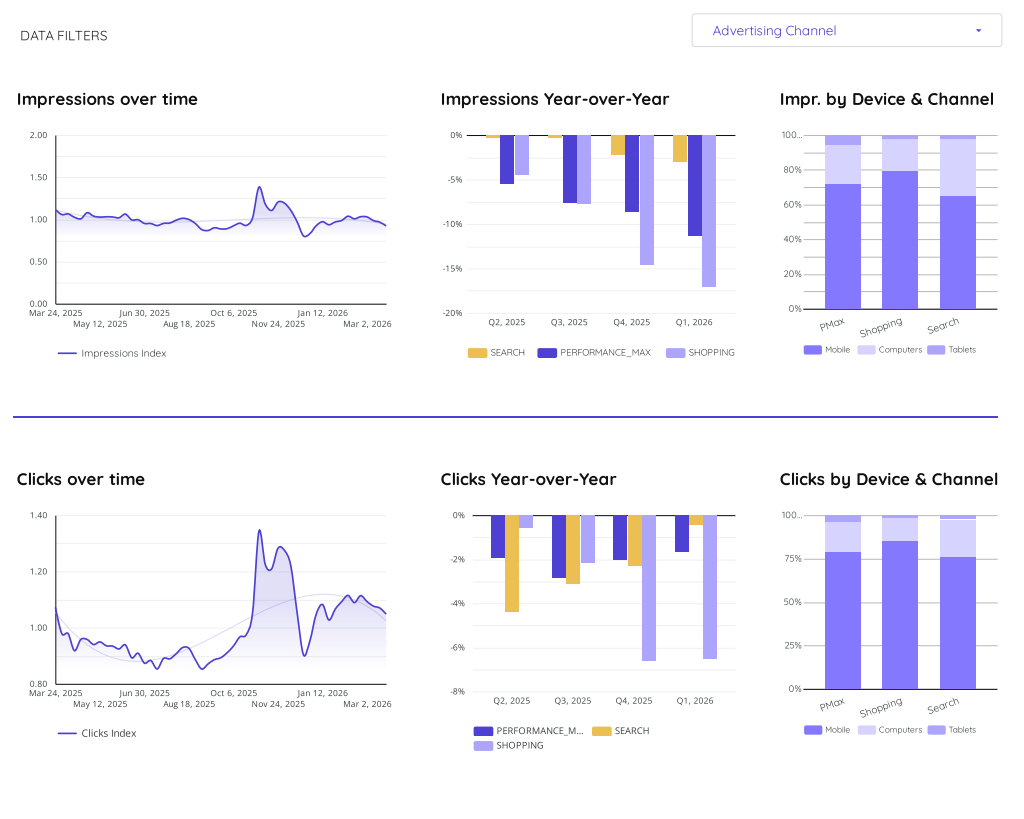
Q1 2026 vs. Q4 2025 Performance Analysis
Impressions: The Year-over-Year (YoY) decline in impressions accelerated across all advertising channels in Q1 2026 compared to the preceding quarter (Q4 2025). Shopping experienced the most severe contraction, dropping from approximately -15% YoY in Q4 2025 to -17% YoY in Q1 2026. Performance Max declines worsened from -9% to -11%, while Search dipped from -2% to -3%.
Clicks: Despite the drop in impressions, click momentum improved for two out of three channels. Search clicks recovered from a -2.5% YoY decline in Q4 2025 to just -0.5% in Q1 2026. Performance Max clicks improved from -2% to -1.5%. Shopping clicks remained stagnant, holding at a -6.5% YoY decline.
Biggest Mover: Search Clicks. This metric represents the most surprising shift. While Search impressions worsened QoQ (falling to -3% YoY), Search clicks saw a significant positive recovery, nearly reaching YoY parity (-0.5%) in Q1 2026 compared to the -2.5% deficit in Q4 2025. This divergence strongly indicates a substantial improvement in Search Click-Through Rate (CTR) during Q1 2026.
Across all channels, Mobile remains the dominant device, driving over 60% of impressions and 75% of clicks).
Google Ads Conversions and Costs Dynamics: European E-commerce (Q1 2026)
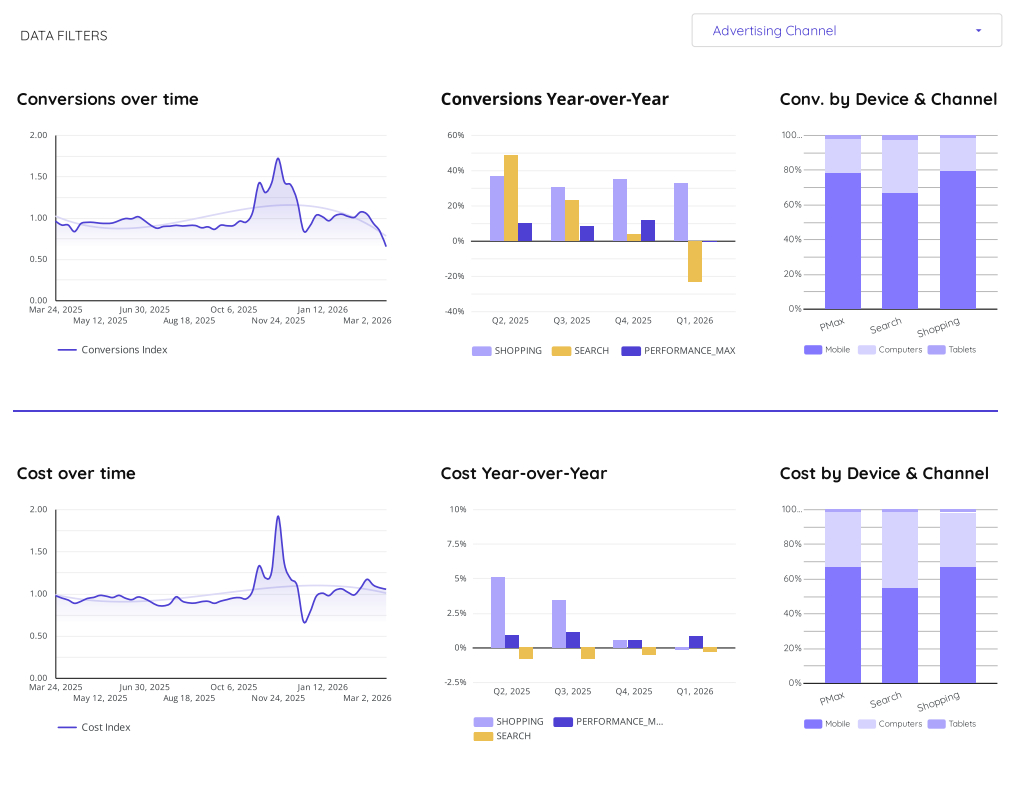
Biggest Mover: The most significant and surprising shift occurred in Search Conversions. In Q4 2025, Search conversions saw a positive Year-over-Year (YoY) growth of approximately 5%. In Q1 2026, this plummeted to roughly -22% YoY. Despite this severe 27-percentage-point drop in conversion growth, Search costs remained relatively flat (-0.5% YoY in Q4 2025 to -0.2% YoY in Q1 2026). Because costs held steady while conversions tanked, this indicates a sharply rising Cost-Per-Acquisition (CPA) and implied rising CPC, which is a strong negative signal for profitability.
Channel Trends (Q1 2026 vs Q4 2025):
- Performance Max (PMax): Conversion growth stalled entirely, dropping from ~12% YoY in Q4 2025 to 0% in Q1 2026. Concurrently, PMax YoY costs doubled from ~0.5% to ~1.0%, signaling declining efficiency.
- Shopping: This remained the most stable and efficient channel. YoY conversion growth stayed robust, dipping only slightly from ~35% in Q4 2025 to ~32% in Q1 2026. Meanwhile, Shopping cost growth dropped from ~0.5% to 0%.
Device Insights: Mobile continues to dominate both cost and conversions, driving nearly 80% of the volume for PMax and Shopping, and roughly 65% for Search, making it the critical device category despite Q1’s efficiency drops in Search and PMax.
Google Ads CTR and Conversion Rates Dynamics: European E-commerce (Q1 2026)
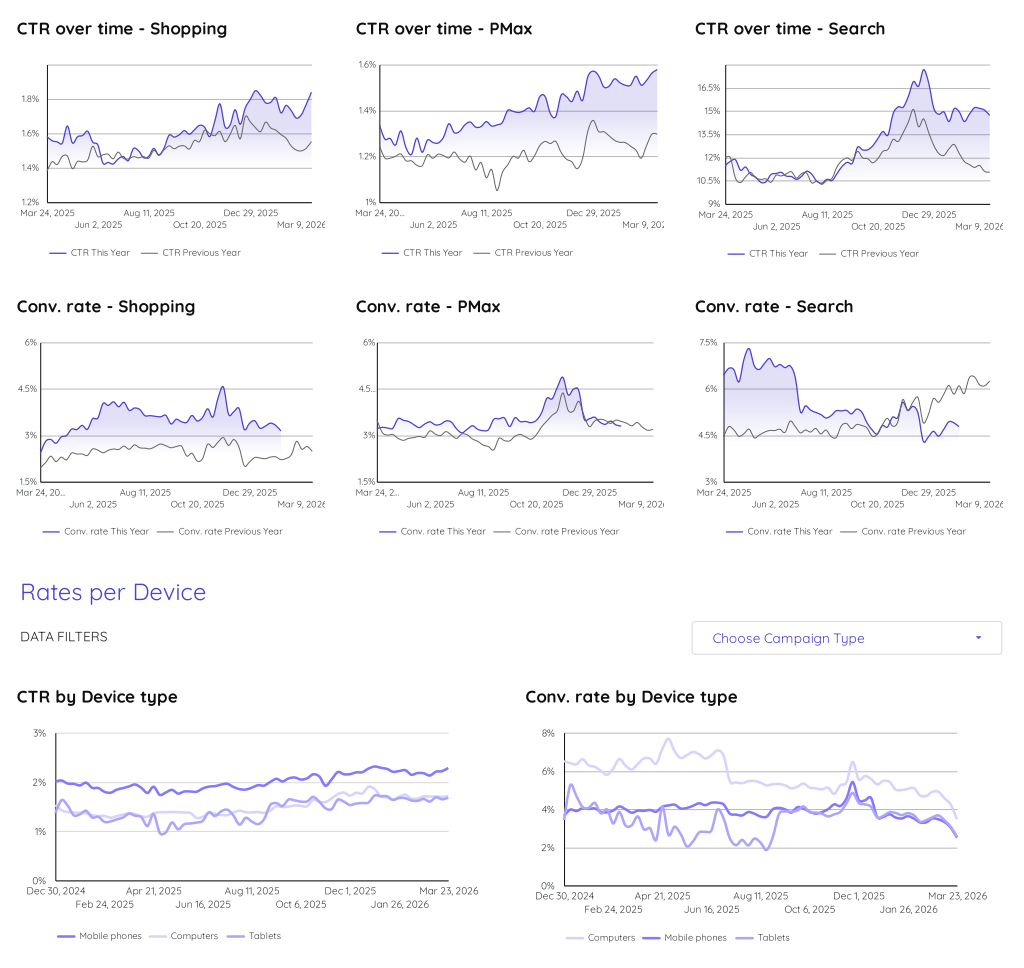
Q1 2026 vs. Q4 2025 Performance Analysis
Click-Through Rate (CTR) Trends:
- Search: Experienced high volatility. After peaking at over 16.5% in late Q4 2025, Search CTR declined to a range of 13.5%–15% in Q1 2026.
- Shopping & PMax: Remained relatively stable QoQ. Shopping CTR hovered between 1.6%–1.8%, while PMax sustained its late-Q4 highs of 1.5%–1.6%.
Conversion Rate Trends:
- Search: Dropped from a Q4 average of ~5.5% to roughly 4.5% in Q1 2026. Notably, Q1 2026 Search conversion rates are significantly underperforming the previous year’s Q1 trend, which exceeded 6%.
- Shopping & PMax: Both saw late Q4 peaks (~4.5% and ~4.8% respectively) before stabilizing at lower baselines of ~3.0%–3.5% throughout Q1 2026.
Device Performance:
- Mobile maintains the highest CTR (~2.2%), but Computers consistently drive the highest conversion rates (~5%).
Biggest Mover: The most significant and surprising shift is the Mobile Conversion Rate. After peaking near 5.5% in early December (Q4 2025), it plummeted steadily throughout Q1 2026, ending the quarter at a low of approximately 2.5%. This sharp 300-basis-point drop contrasts heavily with its stable CTR, indicating a severe decline in mobile traffic quality or post-click user experience in Q1.
Google Ads ROAS and AOV Dynamics: European E-commerce (Q1 2026)
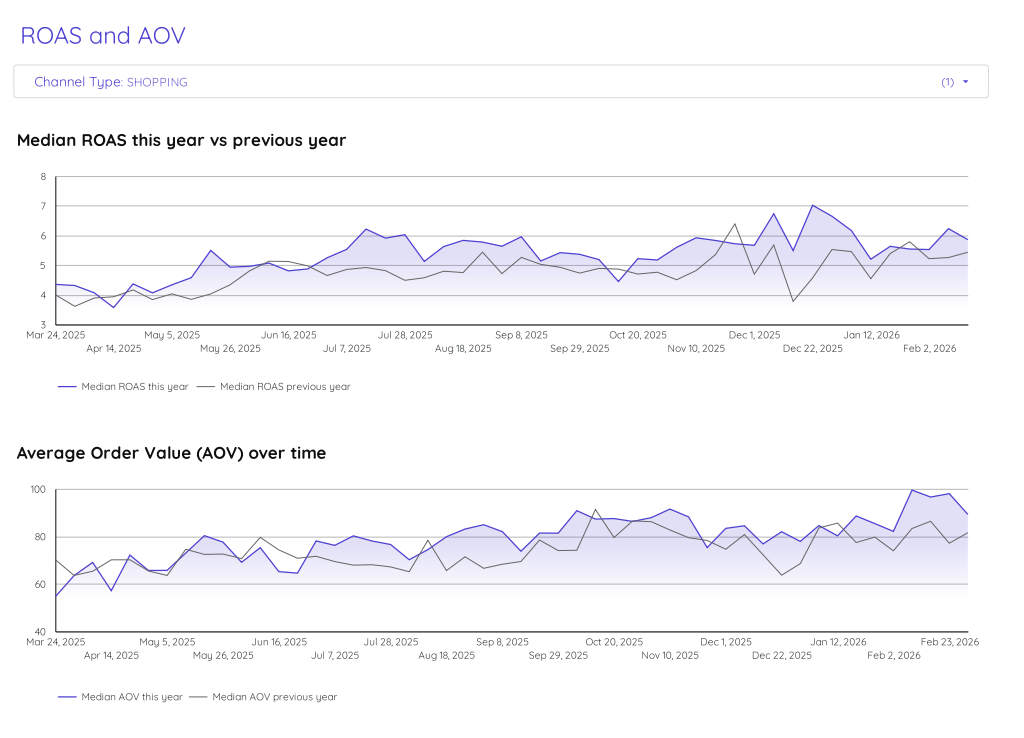
Median ROAS: In Q4 2025, Median ROAS experienced a steady climb, starting near 4.5 in October and peaking at approximately 6.8 in mid-December. Moving into Q1 2026, ROAS hit its highest point for the trailing 12 months at roughly 7.0 in early January. However, it subsequently declined, fluctuating between 5.0 and 6.2 throughout late January and February. While Q1 2026 started with a higher peak, Q4 2025 showed a more consistent upward trajectory.
Average Order Value (AOV): During Q4 2025, AOV fluctuated between 75 and 90, ending the quarter on a downward trend near 80 in late December. In contrast, Q1 2026 demonstrated a dramatic upward trend. After hovering around 80 to 85 in January, AOV surged significantly in February.
Biggest-Mover: The Average Order Value (AOV) is the Biggest-Mover. This metric experienced a surprising and sharp increase from approximately 80 at the end of Q4 2025 to a yearly peak of nearly 100 in mid-February 2026. This represents an approximate 25% increase in peak AOV Quarter-over-Quarter, marking a highly positive shift for overall revenue potential despite the mid-quarter stabilization of ROAS.