Google Ads Ecommerce Benchmarks: Q3 2026 Report
Analyzing over €650M in European ad spend across Search, Shopping, and PMax to reveal where performance is heading.
Impression share of Amazon, Temu, eBay & AliExpress for Q3 2026
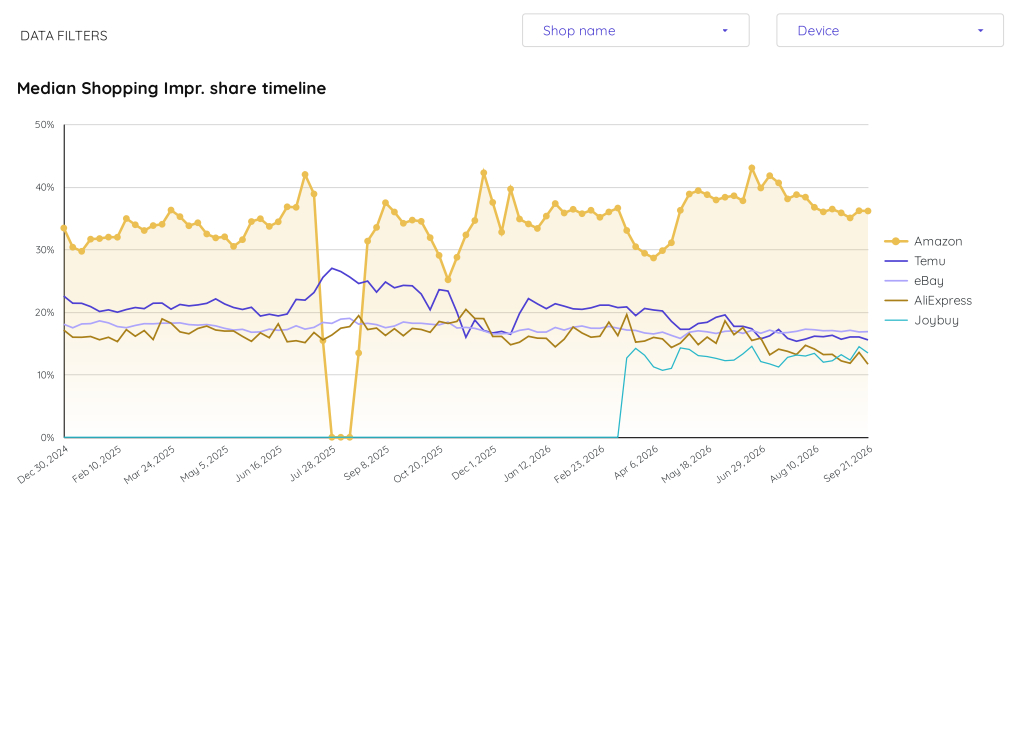
Amazon (Biggest Mover): Amazon exhibited the most significant and surprising shift. During Q2 2026, its median shopping impression share surged from approximately 30% in early April to a peak of 43% by late June. However, Q3 2026 marked a distinct reversal; Amazon’s share steadily declined from 42% in early July down to roughly 36% by late September. Despite this QoQ contraction, it remains the dominant market leader by a wide margin.
Temu: Temu displayed a continuous downward trajectory across both quarters. After starting Q2 near 20%, it slipped to 18% by the end of June, and further degraded throughout Q3 to close September at approximately 16%.
eBay & AliExpress: Both platforms remained relatively stagnant at the bottom of the pack. eBay held steady between 16% and 18% across both Q2 and Q3. AliExpress experienced a slight QoQ degradation, dropping from a Q2 average of roughly 15% to end Q3 near 12%.
Joybuy: After sharply entering the timeline in late Q1 2026, Joybuy stabilized during Q2 and Q3. It maintained a consistent impression share fluctuating between 11% and 14% across both quarters, showing no significant QoQ volatility and closely trailing AliExpress.
Google Ads CPC Dynamics: European E-commerce (Q3 2026)
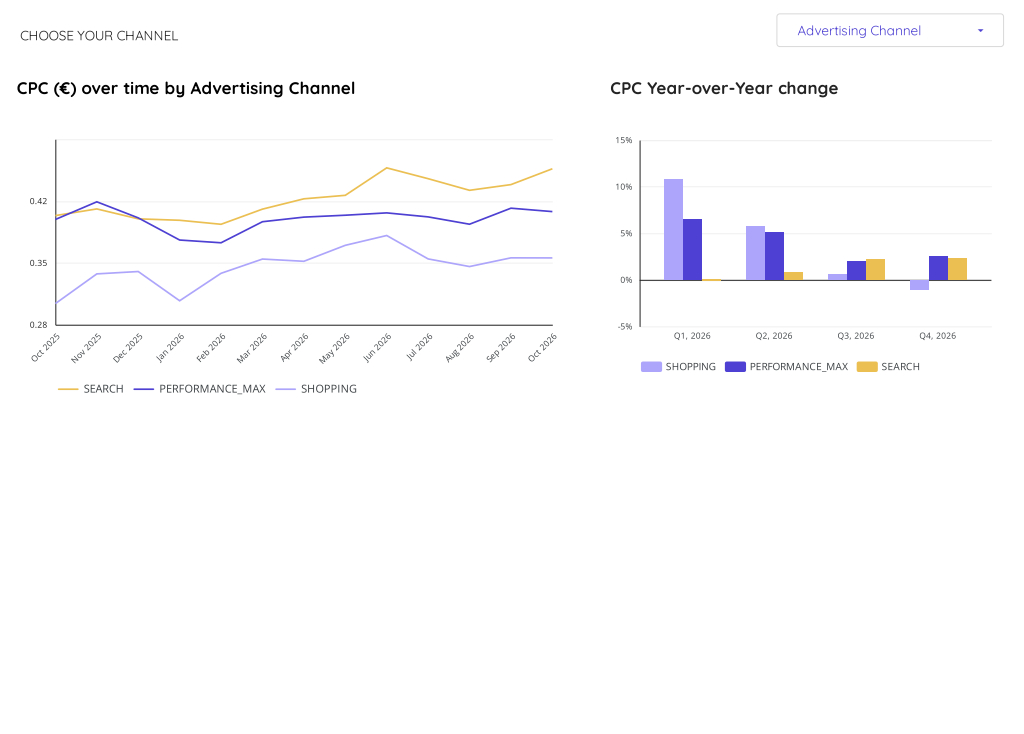
Q3 2026 vs. Q2 2026 CPC Analysis
In Q3 2026, Cost Per Click (CPC) inflation cooled across most advertising channels compared to Q2 2026, presenting a positive shift for ecommerce retailers.
- Shopping: Year-over-Year (YoY) CPC growth decelerated sharply from approximately 6% in Q2 to just 0.5% in Q3. In absolute terms, Shopping CPC dropped from a Q2 peak of ~0.38€ in June to ~0.35€ in July and August, before settling at ~0.36€ in September.
- Performance Max: YoY CPC growth slowed from ~5% in Q2 to ~2% in Q3. Absolute CPC remained relatively stable Quarter-over-Quarter, fluctuating slightly between 0.39€ and 0.41€.
- Search: Conversely, Search CPC YoY growth accelerated from ~1% in Q2 to ~2.5% in Q3, signaling a negative trend for retailers relying heavily on this channel. However, absolute Search CPC in Q3 (~0.44€–0.45€) remained slightly below its Q2 peak of ~0.46€ in June.
Biggest Mover: Shopping is the biggest mover. The channel experienced a massive deceleration in YoY CPC inflation (dropping roughly 5.5 percentage points from Q2 to Q3) alongside a distinct drop in absolute CPC entering Q3. Because rising CPCs are a negative signal, this sharp reduction in CPC growth represents a highly favorable trend, indicating significantly improved cost-efficiency for Shopping campaigns.
Google Ads Clicks and Impressions Dynamics: European E-commerce (Q3 2026)
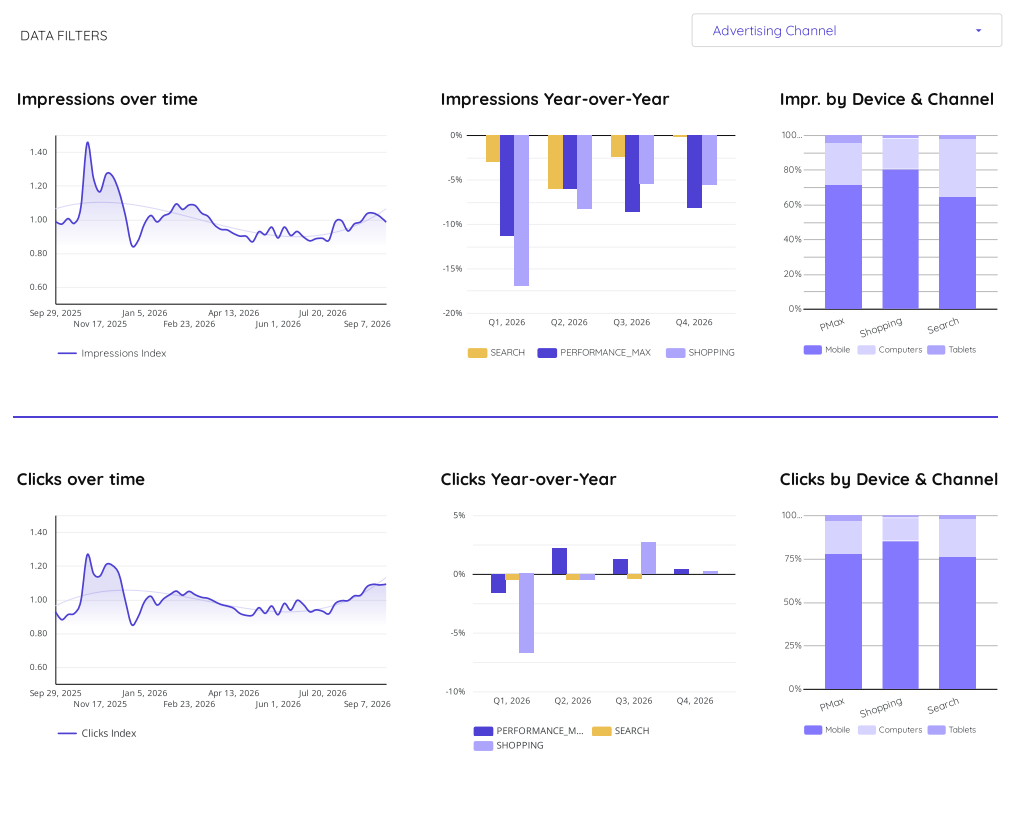
Q3 2026 vs. Q2 2026 Performance Analysis
Impressions (Year-over-Year Trends) In Q3 2026, Search impressions demonstrated a strong recovery, improving from approximately -6% YoY in Q2 to -2% YoY in Q3. Shopping impressions also rebounded, shifting from roughly -8% YoY in Q2 to exactly -5% YoY in Q3. Conversely, Performance Max (PMax) was the only channel to see impression deficits widen, dropping from -6% YoY in Q2 to -8% YoY in Q3.
Clicks (Year-over-Year Trends) Click growth exhibited distinct shifts across channels. Search clicks remained entirely stagnant, holding steady at approximately -0.5% YoY in both Q2 and Q3. PMax click growth decelerated quarter-over-quarter, dropping from +2.5% YoY in Q2 to +1.5% YoY in Q3.
Biggest Mover The Biggest-Mover for Q3 2026 is Shopping Clicks. While Shopping impressions remained in negative YoY territory, its click volume experienced a significant positive reversal. After sitting at roughly -0.5% YoY in Q2 2026, Shopping clicks surged to +3% YoY in Q3 2026. This 3.5 percentage point swing indicates a substantial increase in user engagement and click-through rates for Shopping campaigns, heavily outpacing the growth trends of both Search and PMax during the same period.
Google Ads Conversions and Costs Dynamics: European E-commerce (Q3 2026)
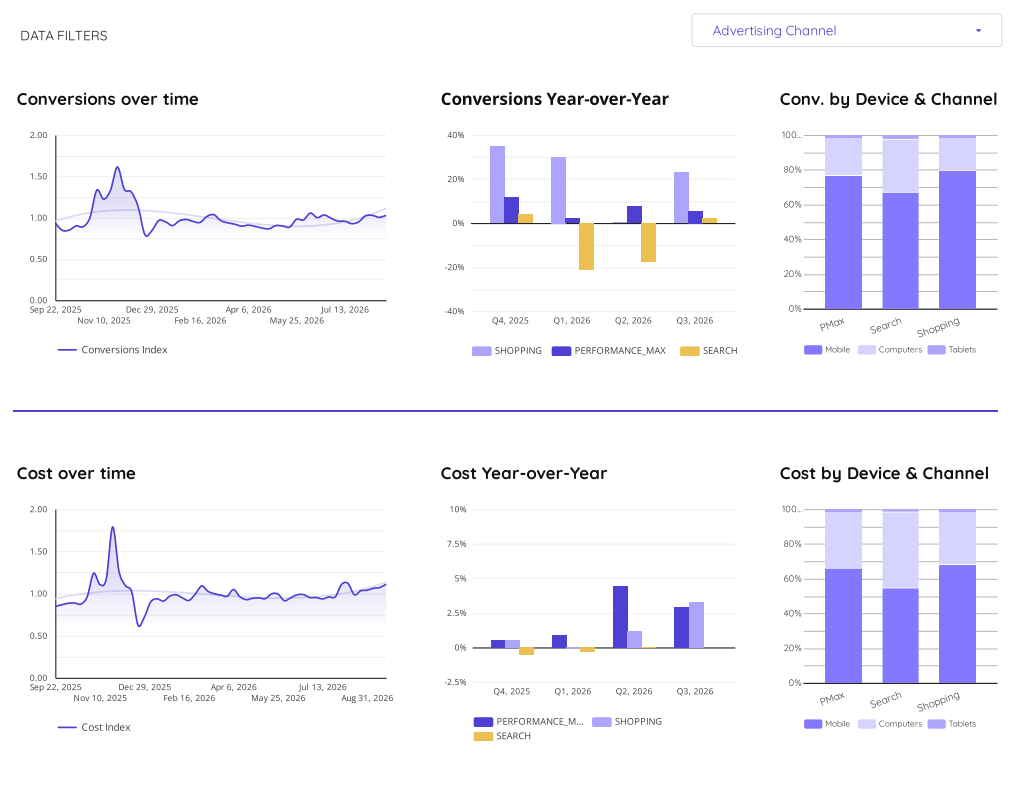
Q3 2026 vs. Q2 2026 Trend Analysis
Conversions (YoY Growth Shifts)
- Shopping: Experienced a massive surge, jumping from ~0% YoY growth in Q2 2026 to ~23% YoY in Q3 2026.
- Search: Showed a strong recovery, rebounding from a severe ~-18% YoY decline in Q2 to a positive ~2% YoY growth in Q3.
- Performance Max: Decelerated slightly, dropping from ~8% YoY growth in Q2 to ~5% YoY in Q3.
Costs (YoY Growth Shifts)
- Shopping: Cost growth increased moderately from ~1.2% YoY in Q2 to ~3.2% YoY in Q3.
- Performance Max: Cost growth slowed down, decreasing from ~4.5% YoY in Q2 to ~3.0% YoY in Q3.
- Search: Costs remained completely flat at ~0% YoY across both quarters.
Biggest-Mover Shopping is the undeniable Biggest-Mover. It achieved a dramatic 23-percentage-point positive swing in YoY conversion growth between Q2 and Q3. Crucially, this explosive growth in conversion volume was highly efficient, as the corresponding YoY cost growth for Shopping only increased by roughly 2 percentage points (from 1.2% to 3.2%). Search also stands out as a significant mover, successfully reversing an 18% contraction into positive growth without any increase in ad spend.
Google Ads CTR and Conversion Rates Dynamics: European E-commerce (Q3 2026)
Q3 2026 vs. Q2 2026 Performance Analysis
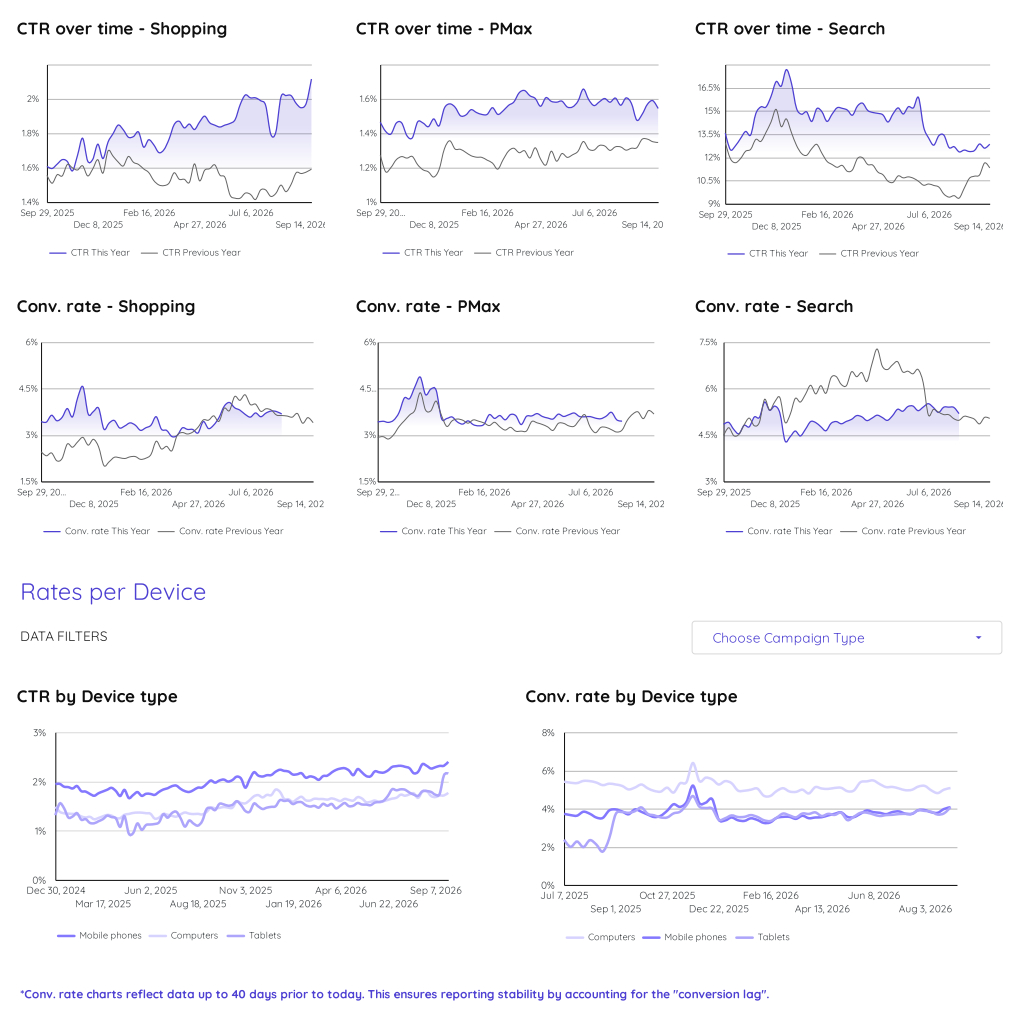
Search Campaigns (Biggest-Mover) Search Click-Through Rate (CTR) is the biggest mover, experiencing a severe quarter-over-quarter decline. Throughout Q2 2026, Search CTR was stable between 15.0% and 15.5%. In Q3 2026, it plummeted from ~15.0% in July to approximately 12.0% by mid-September. Search Conversion Rate showed volatility, peaking at ~5.5% in July before dropping back to ~4.5% by the end of Q3.
Shopping Campaigns Shopping metrics demonstrated positive QoQ momentum. CTR increased from a Q2 average of 1.8% to peak just above 2.0% in Q3. Shopping Conversion Rate also improved, rising from ~3.2% in Q2 to peak near 4.0% in July and August, before settling at ~3.5% in September.
Performance Max (PMax) Campaigns PMax performance remained relatively stagnant. CTR saw a slight contraction from ~1.6% in Q2 to ~1.5% in Q3. Conversion rates stayed flat, hovering consistently around 3.5% across both quarters.
Device Trends Mobile continues to lead in CTR, growing from ~2.1% in Q2 to ~2.3% in Q3. Computers maintained the highest conversion rates overall, holding steady at ~5.0% through both quarters, while Mobile and Tablet conversion rates saw marginal QoQ gains, moving from ~3.8% to ~4.0%.
Google Ads ROAS and AOV Dynamics: European E-commerce (Q3 2026)
Q3 2026 vs Q2 2026 Shopping Channel Analysis
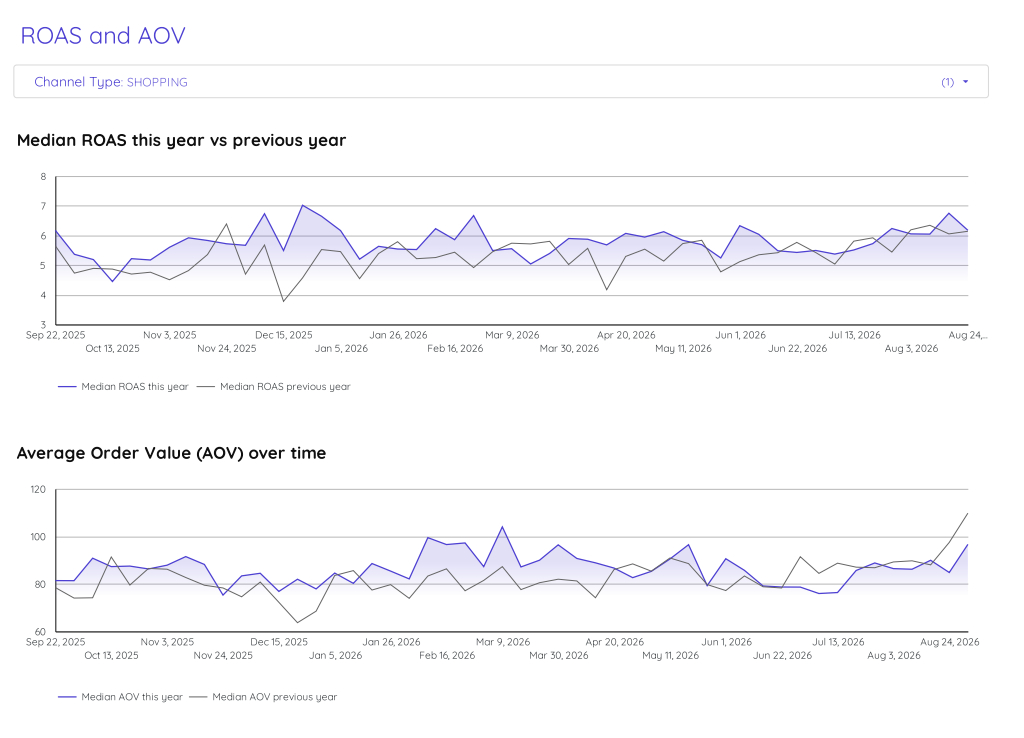
Median ROAS During Q2 2026 (April–June), Median ROAS was volatile, fluctuating between a low of ~5.0 in early June and a brief peak of ~6.3 in mid-June. In Q3 2026 (July–August available data), ROAS initially stabilized between 5.4 and 5.5 throughout July before initiating a strong upward trend. By late August, ROAS peaked at approximately 6.8, marking a distinct late-quarter performance improvement compared to Q2.
Average Order Value (AOV) Q2 2026 AOV showed a downward trajectory toward the quarter’s end, dropping from a mid-May peak of ~95 to ~80 throughout June. Q3 2026 began sluggishly, with AOV dipping to a period-low of ~78 in mid-July. However, it rebounded sharply through August, reaching ~98 by late August.
Biggest-Mover The late-Q3 AOV recovery is the biggest mover. After ending Q2 on a downward trend and bottoming out at ~78 in mid-July, AOV surged by approximately 25% to hit ~98 in late August. This sudden, steep upward shift in AOV directly correlates with the simultaneous ROAS spike (from 5.4 to 6.8), indicating that a surge in high-value orders drove late-Q3 profitability.