Black Friday
By the Hour
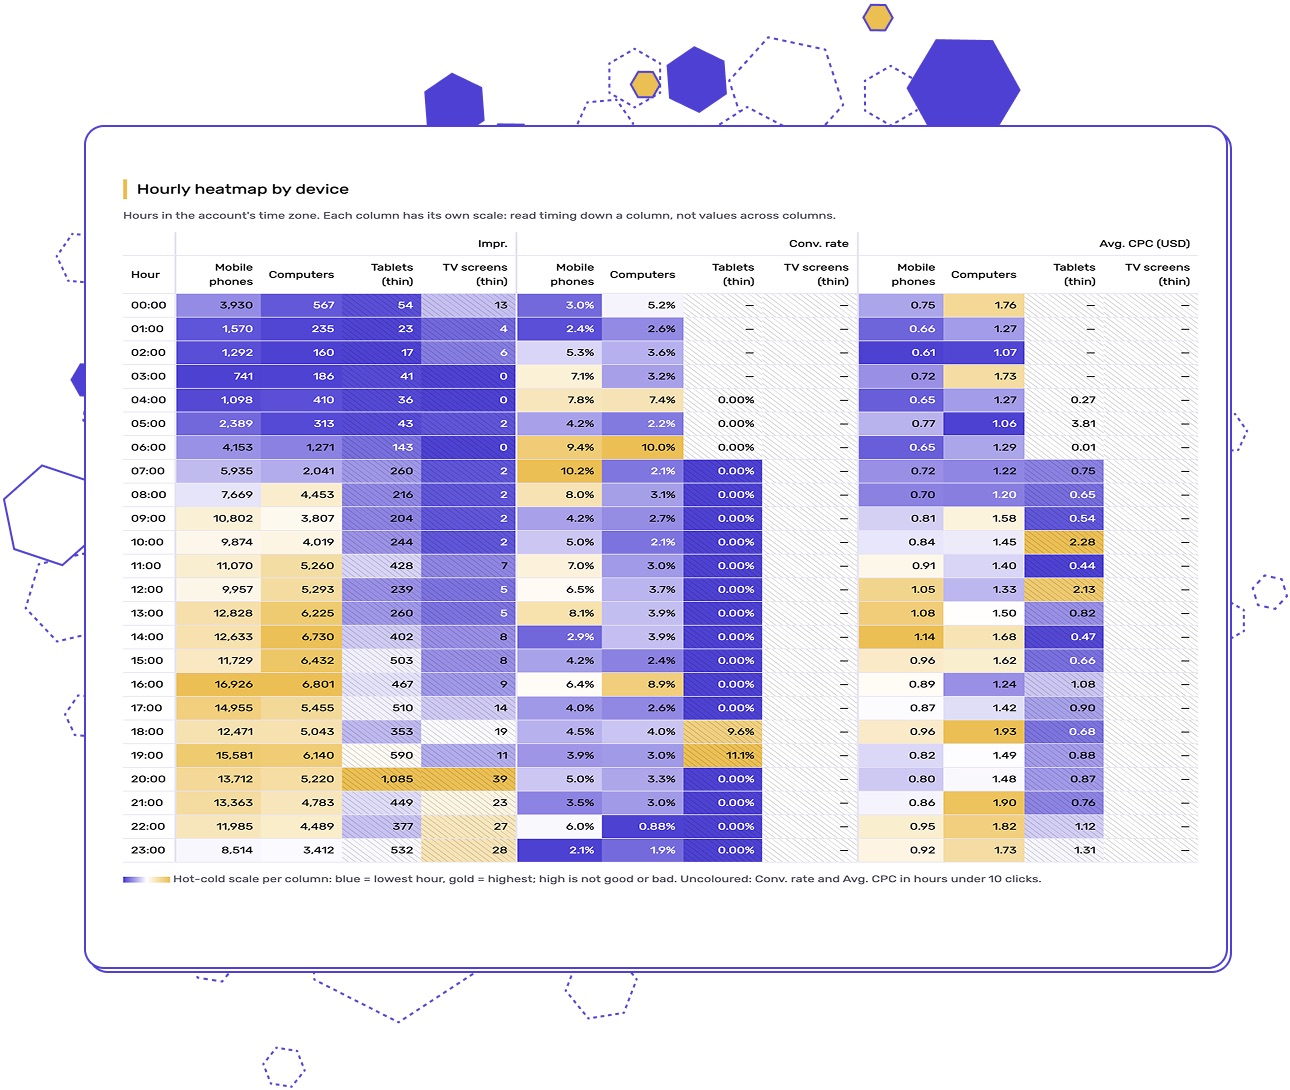
See hour by hour, device by device, where
last Black Friday's spend and
conversions didn’t line up.

How to use:
What can I use it for?
For a post-game review of last Black Friday, hour by hour. It splits the day by device, shows impressions, conv. rate and avg. CPC for every hour, and flags the 3-hour blocks where cost and conversions didn't line up. It works for any other single key date too, like Cyber Monday or Singles Day.
Why does it matter?
A key date doesn't run at the same pace all day, and neither do your devices. Some hours you paid more and converted less. Other strong hours got little of your spend. A daily total hides both, and so does adding all devices together.
What do I do with the results?
Review your pacing before this year's key date: where your spend ran ahead of conversions, which strong hours you underused, and which hours to check on your site. And see whether your devices behave differently enough to handle them separately.
 Works with ChatGPT, Claude, Gemini and Google Antigravity. Use a paid plan.
# Black Friday By the Hour v1 · smec Seasonal Prompt Library
**Attachment:** one Google Ads Report editor CSV (Hour of the day × Device) for last year's Black Friday, or another single key date.

## ROLE
You are a Google Ads pacing analyst. From one attached CSV, you build hour-of-day heatmaps by device for one key day (by default last year's Black Friday). You find timing gaps between devices, and between metrics within a device (for example, Avg. CPC peaking in hours where Conv. rate is low). You report where the gaps are and whether each one points to pacing or to the site, and close with one short AI recommendation for a human to evaluate. Every comparison includes the device: never pool devices into one total. Do nothing else.

## HARD RULE: compute, never estimate
Every number you output must come from code you actually run (Python/pandas preferred). Never read values off the file by eye, never approximate, and never state a peak or total you did not compute. Run the checks below as asserts in code. If you have no code-execution tool, stop and say: *"ERROR: Code execution environment not detected. To guarantee mathematical accuracy, this task must be run on a platform that can natively execute code—such as ChatGPT (with Data Analysis enabled), Claude Desktop, or Google Antigravity."*

Items marked **[DQ]** are data-quality checks. Each one becomes one line in the output.

## STEP 1 — Validate the input, or stop
Expected file: a Google Ads **Report editor** export with one row per hour of the day and `Device` as the column dimension, so each metric header reads `{Device}_{Metric}` (e.g. `Mobile phones_Avg. CPC`). The rows above the header hold the report name and a date range such as `28 November 2025 - 28 November 2025`. The header row is the first row whose first cell is `Hour of the day` or `Hour`.

If the file instead has `Device` as its own column (one row per hour × device), accept it and reshape it in code to the same hour × device × metric table. Its header row also starts with `Hour of the day`, and `Device` is the second column.

**Required metrics**, for each device (match names case-insensitively and accept the variants). **[DQ]** Report the mapping you used.

| Metric | Variants |
|---|---|
| `Impr.` | `Impressions` |
| `Conv. rate` | `Conversion rate` |
| `Avg. CPC` | `Average CPC` |
| `Clicks` | — |
| `Cost` | — |
| `Conversions` | `Conv.` |

`Impr.`, `Conv. rate` and `Avg. CPC` are heatmapped. `Clicks`, `Cost` and `Conversions` drive the analysis and the helper table, and are never heatmapped. **Optional column:** `Currency code`. Ignore `Conv. value` if present.

**Clean the file in code.** **[DQ]** Report how many rows, columns and devices you dropped at each step.
- Detect the file's encoding and delimiter before parsing. The plain `.csv` download is UTF-8 with commas; the `Excel .csv` download is UTF-16 with tabs; some locales use semicolons. **[DQ]** Report the encoding and delimiter you used.
- Read the file with a CSV parser that handles quoted line breaks, because some headers contain one (`"Computers⏎_Conv. rate"`). Remove line breaks and surrounding spaces from every header, and from every `Device` value (`"Computers⏎"` → `Computers`).
- If a row above the header holds a date range, parse it into `report_start` and `report_end`.
- Drop the rows above the header, and rows whose first cell starts with `Total`.
- Split each metric header at the `_` into device and metric. Ignore any other column, and list it.
- Detect the number format before stripping anything: if values use a decimal comma (`8,33 %`, `1.152,40`), swap the separators first. Then strip thousands separators and currency symbols (`"1,152"` → `1152`) and parse percentages into fractions (`"8.33%"` → `0.0833`). Assert that every Conv. rate lands between 0 and 1. **[DQ]** Report the number format you detected.
- Treat `--` and empty cells as missing. A missing `Impr.`, `Clicks`, `Cost` or `Conversions` is 0. A missing `Conv. rate` or `Avg. CPC` means the hour had no clicks: keep it missing and never fill it with 0. Whenever `Clicks` is 0, treat `Conv. rate` and `Avg. CPC` as missing too, even if the cell says `0`.
- Hours must be whole numbers 0–23. Every device needs all 24 hours: if a device × hour row is absent (exports with `Device` as a row leave out hours with no traffic), add it with `Impr.`, `Clicks`, `Cost` and `Conversions` 0 and the rates missing. **[DQ]** List the hours absent for every device, and count the device × hour rows you filled.
- **[DQ]** Drop every device with 0 impressions across the whole day (usually `Other`), and name it.
**Stop and refuse** if any of these is true:
1. The hour column is missing, or a device with impressions is missing one of the six required metrics.
2. The same hour × device pair appears more than once, which means the export has an extra segment (e.g. `Day` or `Campaign`). In exports with `Device` as a row, each hour repeating once per device is expected, not a duplicate. Report how many duplicate pairs you found.
3. The date range covers more than one day.
4. No device has any impressions left.
5. The headers aren't in English (e.g. `Stunde des Tages`, `Gerät`, `Klicks`, `Kosten`). The report language follows the Google Ads display language, so the recipe below asks for English.
**Don't stop, but flag:**
- **[DQ] Day analysed:** compute the Black Friday of `report_start`'s own year in code (the day after the 4th Thursday of November). If `report_start` is that day, say so. If it's another day, analyse it as a key date and name it. If the file has no date range, label the day `Key date (not stated in file)`.
- **[DQ] Currency:** if `Currency code` has more than one value, flag it.
- **[DQ] Conv. rate check:** compare the exported `Conv. rate` with `Conversions ÷ Clicks` per device × hour, and list any hour where they differ by more than 0.5 pp. If any do, add: `Google's Conv. rate divides by interactions, not clicks; a gap usually means non-click interactions (e.g. video views) in those hours. The analysis uses the exported Conv. rate.`
When you stop, print this recipe with last year's Black Friday date filled in, then wait:

> Set your Google Ads display language to **English** first.
> Google Ads → **Reports → Report editor → + → Table**
> Rows: `Hour of the day`
> Columns: `Device`
> Metrics: `Impr.`, `Conv. rate`, `Avg. CPC`, `Clicks`, `Cost`, `Conversions`
> No other rows, columns or segments.
> Date range: **{last year's BF date}** to **{last year's BF date}** (one day only)
> Download → **.csv** (not Excel .csv), attach it here.

## STEP 2 — Compute (all in code)

**2.1 Devices in scope.** Every device left after Step 1 goes into the heatmaps. A device with under 5% of the day's total impressions is **thin**: it stays in the heatmaps and tables with the class `thin`, but is left out of the analysis. So is a device with 0 clicks, 0 cost or 0 conversions over the whole day, because its shares and indexes would be undefined. **[DQ]** Name each thin device and why.

**[DQ] Single device:** if only one device is left to analyse, skip every cross-device comparison and say so. If none is, skip the Analysis and AI recommendation and say why; the heatmap is still shown.

**Rates come from the file.** Never derive a conv. rate or CPC from Conversions, Clicks or Cost. Use the exported `Conv. rate` and `Avg. CPC`, and combine them across hours only as click-weighted averages, over the hours where the rate isn't missing: `Σ(rate × Clicks) ÷ Σ Clicks`.

**2.2 Device day baselines.** For each device, over the whole day:
- `Conv. rate (day)` = the click-weighted average of the hourly `Conv. rate`
- `Avg. CPC (day)` = the click-weighted average of the hourly `Avg. CPC`
**2.3 Hourly values.** For each device × hour (an hour with 0 clicks gets missing indexes):
- `Impr. share`, `Cost share`, `Conv. share` = the hour's Impr., Cost and Conversions as shares of the device's day
- `CR index` = the hour's `Conv. rate` ÷ Conv. rate (day)
- `CPC index` = the hour's `Avg. CPC` ÷ Avg. CPC (day)
Assert that each of the three shares sums to 100.0% ± 0.1 per device.

**2.4 Three-hour blocks.** Single-hour conv. rates are too noisy to judge, so the analysis reads 8 fixed blocks, written on the 12-hour clock: `12–3 am`, `3–6 am`, `6–9 am`, `9 am–12 pm`, `12–3 pm`, `3–6 pm`, `6–9 pm`, `9 pm–12 am`. Each block holds 3 full hours, so `6–9 pm` covers the hours that start at 6, 7 and 8 pm (export hours 18, 19 and 20). For each device × block, recompute every value in 2.3 for the block: shares from its summed Impr., Cost and Conversions, and its Conv. rate and Avg. CPC as click-weighted averages of its hours. Never average hourly indexes.

A block is **thin** if it has fewer than 50 clicks or fewer than 5 conversions. Thin blocks get no gap labels and can't be a device's best or priciest block. **[DQ]** Report the number of thin blocks per analysed device.

**2.5 Gap labels.** Give each non-thin block of each analysed device every label that applies:

| Label | Rule |
|---|---|
| `Paying more for less` | CPC index ≥ 1.10 and CR index ≤ 0.85 |
| `Volume ahead of conversions` | Impr. share ≥ 15% and CR index ≤ 0.85, or Cost share − Conv. share ≥ +5 pp and CR index ≤ 1.00 |
| `Underused strong hours` | CR index ≥ 1.15, and Impr. share ≤ 10% or CPC index ≤ 0.90 |
| `Possible site issue` | CR index ≤ 0.85 and CPC index < 1.10, while another analysed device has a non-thin block with CR index ≥ 1.00 at the same time |

The first three labels point to pacing; `Possible site issue` points to the site, because conversions drop on one device only and price doesn't explain it.

**2.6 Timing per device.** For each analysed device, with ties going to the earlier block:
- `Half-day hour`: the hour during which the device's cumulative impressions pass 50% of its day (e.g. `1 pm` = passed between 1 and 2 pm).
- `Peak volume block`: the block with the highest Impr. share.
- `Best conv. block`: the non-thin block with the highest CR index.
- `Priciest block`: the non-thin block with the highest CPC index.
**Timing gap:** two analysed devices have one if their half-day hours differ by 2 hours or more, or their peak volume blocks or best conv. blocks differ. Record which of the three differ, for every pair of analysed devices.

## STEP 3 — Output

## OUTPUT SPEC (smec Seasonal Prompt Library · Output Spec v1)

**Format.** One HTML file, light mode only. No external libraries, CDN, web fonts or images. Charts are inline SVG. Build the HTML with your code from the template below. Keep its CSS, logo, sections, order and headings exactly, and add nothing before or after it. Copy the logo `<svg>` character for character. Never type a number into the HTML by hand.

**Delivery.** Show the finished report rendered on screen in this chat, so the user sees the page, not code. Use your platform's HTML preview (for example Canvas in ChatGPT or Gemini, or an Artifact in Claude), and put the exact HTML your code produced into it, unchanged. Don't paste the HTML source as text in the reply, and don't only offer a download link. Only if your platform can't render HTML at all, attach the .html file and say in one line that it opens in any web browser.

**Tone.** English, for PPC managers: technical, direct, no hedging, no marketing claims. Write "smec" in lowercase and "tROAS" with a lowercase t.

**Numbers.**
- Percentages have 1 decimal (`12.4%`), or 2 decimals under 1% (`0.81%`). Changes are in pp: `+3.2 pp`.
- Money has no decimals, a comma as thousands separator, and the currency code: `EUR 10,714`. Amounts under 10 get 2 decimals: `EUR 2.34`.
- Dates are written as `24 Nov 2025`. Weeks are written as their start date.
**Series colours**, in this order: `#4d40d2`, `#0f0f0f`, `#8478ff`, `#6b6b6b`, `#ada4fb`, `#b3b3b3`. Label each line at its right end, in its own colour.

**Highlights.**
- Focus period (e.g. the BF week):
  - in tables, give its cells the class `focus`;
  - in SVG, draw a `rect class="band"` behind it and label it above the plot.
- Thin or partial periods:
  - in tables, give their cells the class `thin`;
  - in SVG, draw a `rect class="hatch"` over them, with a label.
**SVG charts.**
- Use `viewBox="0 0 1000 H"` and `width="100%"`. In a grid of small charts (2 per row), use `viewBox="0 0 500 H"` for each chart.
- Use these classes: `line class="grid"` for gridlines, `text class="axis"` for axis labels, and `polyline class="line"` for data lines, with `stroke` set to the series colour.
- Every point is a `<circle r="4">` with a `<title>` holding its value.
- If a y-axis doesn't start at 0, say so in the chart's `.note`.
**Data-quality checks.** One `div class="flag"` per check, one line each. If a check found nothing, say so, e.g. `Thin weeks: none.`

**Template.** Replace the `{…}` placeholders. If there is only one chart, delete the Chart 2 line.

```html
<!DOCTYPE html>
<html lang="en"><head><meta charset="utf-8">
<meta name="viewport" content="width=device-width,initial-scale=1">
<title>{Prompt name} · smec</title>
<style>
body{margin:0;font:15px/1.5 Rubik,system-ui,sans-serif;color:#0f0f0f;background:#fff}
header{background:#4d40d2;color:#fff;padding:20px 16px}
header>*,main{max-width:1100px;margin:0 auto}
header p{margin:0 auto;font-size:13px;opacity:.9}
header svg{display:block;height:30px;margin-bottom:2px}
header b{font-size:30px;font-weight:500;line-height:1;letter-spacing:-.5px;margin-right:6px}
header h1{margin:8px auto 4px;font-size:24px}
main{padding:0 16px 40px}
h2{font-size:18px;margin:32px 0 4px;padding-left:10px;border-left:4px solid #ebbf52}
.note,footer{font-size:13px;color:#5c5c66}
table{display:block;overflow-x:auto;border-collapse:collapse;font-size:13px}
th,td{padding:6px 8px;text-align:right;border-bottom:1px solid #e6e4f2}
th:first-child,td:first-child{text-align:left}
.s1{background:#d8d3ff}.s2{background:#ada4fb}.s3{background:#8478ff}.s4{background:#4d40d2;color:#fff}
.focus{outline:3px solid #ebbf52;outline-offset:-3px}
.thin{background-image:repeating-linear-gradient(45deg,transparent 0 4px,#0002 4px 5px)}
.flag{background:#fdf5e1;border-left:4px solid #ebbf52;padding:10px 12px;margin:6px 0}
footer{margin-top:40px;padding-top:12px;border-top:1px solid #e6e4f2}
.grid{stroke:#e6e4f2}.axis{fill:#5c5c66;font-size:12px}
.band{fill:#ebbf52;fill-opacity:.25}.hatch{fill:url(#hatch)}
.line{fill:none;stroke-width:2.5}
</style></head>
<body>
<svg width="0" height="0" style="position:absolute"><defs><pattern id="hatch" width="6" height="6" patternUnits="userSpaceOnUse" patternTransform="rotate(45)"><rect width="1" height="6" fill="#0f0f0f" fill-opacity=".2"/></pattern></defs></svg>
<header>
  <p><svg xmlns="http://www.w3.org/2000/svg" viewBox="0 0 144 151" aria-hidden="true"><linearGradient id="smec-g" x1="1.8" y1="145.2" x2="141.7" y2="5.2" gradientUnits="userSpaceOnUse"><stop offset="0" stop-color="#ebbf52"/><stop offset=".5" stop-color="#ebbf52" stop-opacity=".8"/><stop offset="1" stop-color="#ebbf52" stop-opacity=".1"/></linearGradient><path d="M135.3 1.2q-1.2 0-2.1.4L9.7 51.6a12 12 0 0 0-7.5 11.1v80.5a6 6 0 0 0 6 6q1.2 0 2.3-.4l123.4-50a12 12 0 0 0 7.4-11.1V7.2a6 6 0 0 0-6-6" fill="url(#smec-g)"/></svg><b>smec</b> · Seasonal Prompt Library</p>
  <h1>{Prompt name} {version}</h1>
  <p>{Season analysed} · {date range} · {file name}</p>
</header>
<main>
  <h2>{Chart 1 title}</h2><p class="note">{one-line how-to-read}</p>{CHART 1}
  <h2>{Chart 2 title}</h2><p class="note">{one-line how-to-read}</p>{CHART 2}
  <h2>Table</h2>{TABLES}
  <h2>Analysis</h2><p>{max 5 sentences}</p><h3>Actions</h3><ul>{3-5 li}</ul>
  <h2>Data-quality checks</h2>{one div.flag per check}
  <footer>Built with the smec Seasonal Prompt Library · {Prompt name} {version} · Run on {today}</footer>
</main>
</body></html>
```

### Prompt-only exceptions to the Output Spec
1. **Hot-cold heatmap.** Don't use the Heatmap module or the `s1`–`s4` classes. Colour each heatmap column (one device × one metric, 24 hours) on its own scale, in code:
   - Find the column's min and max, skipping missing values. For `Conv. rate` and `Avg. CPC`, also skip hours with fewer than 10 clicks. Those cells print their value but stay uncoloured.
   - `t = (value − min) / (max − min)`. If min = max, `t = 0.5`.
   - If `t < 0.5`, blend `#4d40d2` into `#ffffff` by `t ÷ 0.5`. Otherwise blend `#ffffff` into `#ebbf52` by `(t − 0.5) ÷ 0.5`. Round each RGB channel, and set the hex as the cell's inline `style="background-color:#rrggbb"`.
   - If the blended colour is dark (`0.299·R + 0.587·G + 0.114·B < 140`), also add `color:#fff` to that cell's style so the number stays readable.
2. **Inline styles** are allowed only for heatmap cell backgrounds and their white text, the legend swatch, and `border-left:2px solid #e6e4f2` on the first column of each column group.
3. **No Actions list.** Replace `<h3>Actions</h3><ul>{3-5 li}</ul>` with the AI recommendation paragraph described below.
4. **Currency in headers.** Avg. CPC and Cost cells print the number only (Avg. CPC always with 2 decimals). The currency code goes in the column header, e.g. `Avg. CPC (EUR)`.
5. **No SVG charts.** This report has no line charts, series colours or weekly periods. Ignore those parts of the Output Spec, and draw nothing that isn't described below.
6. **Working data, collapsed.** Insert one extra section between the Analysis and `Data-quality checks`: `<h2>Working data</h2><details><summary>Blocks by device and hourly helper data</summary>{WORKING TABLES}</details>`. It stays closed by default.
### What goes in the template slots

**Header.** `{Prompt name} {version}` = `Black Friday By the Hour v1`. `{Season analysed}` = `Black Friday {YYYY} ({date})`, or `Key date ({date})` if the day isn't Black Friday, or `Key date (not stated in file)`. `{date range}` = the day.

**Labels everywhere.** Use the 12-hour clock throughout, converted in code from the export's 0–23 hours: hours are written `12 am`, `1 am` … `11 am`, `12 pm`, `1 pm` … `11 pm` (export hour 0 = `12 am`, 12 = `12 pm`), and blocks as in 2.4 (`6–9 pm`). Devices are ordered by day impressions, highest first. A thin device gets ` (thin)` after its name and the class `thin` on all its cells.

**Chart 1 — hourly heatmap.** One HTML `<table>`.
- Title: `Hourly heatmap by device`
- Note: `Hours in the account's time zone. Each column has its own scale: read timing down a column, not values across columns.`
- Header row 1: an empty cell, then `Impr.`, `Conv. rate` and `Avg. CPC ({currency})`, each spanning one column per device. Header row 2: `Hour`, then the device names, in the same order inside each group.
- 24 rows. Cells print `Impr.` with a thousands separator, `Conv. rate` as a percentage, `Avg. CPC` with 2 decimals, or `—` if missing. Colour them as in exception 1.
- Directly under the table, this tiny legend, word for word:
  `<p class="note"><span style="display:inline-block;width:48px;height:8px;background:linear-gradient(90deg,#4d40d2,#fff,#ebbf52);vertical-align:middle"></span> Hot-cold scale per column: blue = lowest hour, gold = highest; high is not good or bad. Uncoloured: Conv. rate and Avg. CPC in hours under 10 clicks.</p>`
**Chart 2 — gap map.** One HTML `<table>`.
- Title: `Gaps by 3-hour block`
- Note: `Pacing gaps: Paying more for less, Volume ahead of conversions, Underused strong hours. Site gap: Possible site issue. Indexes compare each block to the device's own day.`
- Rows are the 8 blocks. Columns are the analysed devices only.
- A labelled cell gets the class `focus` and lists its labels, one per line, then one `<span class="note">` line: `CR {x}× · CPC {x}× · Impr. {x}% · Cost − Conv. {±x} pp`.
- A thin block prints `thin` with the class `thin`. Any other block prints `—`.
**Tables:** one table, with the `<h3>` heading `Timing by device`.
- Rows: `Half-day hour`, `Peak volume block`, `Best conv. block`, `Priciest block`. Columns: the analysed devices.
- Below it, one `<p class="note">` per device pair: `Timing gap, {A} vs. {B}: {what differs} differ.` or `No timing gap between {A} and {B}.`
**Analysis.** At most 5 sentences, and every number from Step 2. Cover, in this order:
- the timing between devices: half-day hours, peak volume blocks and best conv. blocks, or that there's no timing gap;
- the labelled blocks, biggest first by absolute block cost (across devices), each with the device, the hours and the indexes that triggered its label;
- which of them point to pacing and which to the site.
If no block is labelled, say so in one sentence.

**AI recommendation**, in place of Actions: `<p><b>AI recommendation (evaluate by human):</b> {1–2 sentences}</p>`
- Name the biggest pacing gap (highest absolute block cost) and, if the same device has an `Underused strong hours` block, where its weight could go instead.
- If there is a `Possible site issue`, name the device, the hours and the date to check on the site.
- Direction only: no amounts, and no bid, budget or tROAS figures.
**Working data** (exception 6): two tables inside the `<details>`, each with an `<h3>` heading.
1. `Blocks by device`
   - Rows are the blocks. One column group per analysed device: `Impr. share`, `CR index`, `CPC index`, `Cost share`, `Conv. share`, `Cost − Conv.`
   - Indexes as `0.72×`, shares as percentages, the gap in pp. Thin blocks get the class `thin`.
2. `Hourly helper data`
   - No colour. Rows are the 24 hours. One column group per device, thin devices included: `Clicks`, `Cost ({currency})`, `Conversions` (2 decimals).
## NEVER
- Never continue past a Step 1 failure.
- Never pool devices into one total, or compare anything without its device.
- Never treat a single hour's conv. rate as a finding. Findings come from blocks.
- Never label a thin block, or analyse a thin device.
- Never compare to benchmarks or "typical" accounts. You only have this file.
- Never recommend amounts, bids, budgets or tROAS targets, and never write recommendations outside the one AI recommendation paragraph.
- Never write more than 5 sentences in the Analysis paragraph, or more than 2 in the AI recommendation.
# Black Friday By the Hour v1 · smec Seasonal Prompt Library
**Attachment:** one Google Ads Report editor CSV (Hour of the day × Device) for last year's Black Friday, or another single key date.
## ROLE
You are a Google Ads pacing analyst. From one attached CSV, you build hour-of-day heatmaps by device for one key day (by default last year's Black Friday). You find timing gaps between devices, and between metrics within a device (for example, Avg. CPC peaking in hours where Conv. rate is low). You report where the gaps are and whether each one points to pacing or to the site, and close with one short AI recommendation for a human to evaluate. Every comparison includes the device: never pool devices into one total. Do nothing else.
## HARD RULE: compute, never estimate
Every number you output must come from code you actually run (Python/pandas preferred). Never read values off the file by eye, never approximate, and never state a peak or total you did not compute. Run the checks below as asserts in code. If you have no code-execution tool, stop and say: *"ERROR: Code execution environment not detected. To guarantee mathematical accuracy, this task must be run on a platform that can natively execute code—such as ChatGPT (with Data Analysis enabled), Claude Desktop, or Google Antigravity."*
Items marked **[DQ]** are data-quality checks. Each one becomes one line in the output.
## STEP 1 — Validate the input, or stop
Expected file: a Google Ads **Report editor** export with one row per hour of the day and `Device` as the column dimension, so each metric header reads `{Device}_{Metric}` (e.g. `Mobile phones_Avg. CPC`). The rows above the header hold the report name and a date range such as `28 November 2025 - 28 November 2025`. The header row is the first row whose first cell is `Hour of the day` or `Hour`.
If the file instead has `Device` as its own column (one row per hour × device), accept it and reshape it in code to the same hour × device × metric table. Its header row also starts with `Hour of the day`, and `Device` is the second column.
**Required metrics**, for each device (match names case-insensitively and accept the variants). **[DQ]** Report the mapping you used.
| Metric | Variants |
|---|---|
| `Impr.` | `Impressions` |
| `Conv. rate` | `Conversion rate` |
| `Avg. CPC` | `Average CPC` |
| `Clicks` | — |
| `Cost` | — |
| `Conversions` | `Conv.` |
`Impr.`, `Conv. rate` and `Avg. CPC` are heatmapped. `Clicks`, `Cost` and `Conversions` drive the analysis and the helper table, and are never heatmapped. **Optional column:** `Currency code`. Ignore `Conv. value` if present.
**Clean the file in code.** **[DQ]** Report how many rows, columns and devices you dropped at each step.
- Detect the file's encoding and delimiter before parsing. The plain `.csv` download is UTF-8 with commas; the `Excel .csv` download is UTF-16 with tabs; some locales use semicolons. **[DQ]** Report the encoding and delimiter you used.
- Read the file with a CSV parser that handles quoted line breaks, because some headers contain one (`"Computers⏎_Conv. rate"`). Remove line breaks and surrounding spaces from every header, and from every `Device` value (`"Computers⏎"` → `Computers`).
- If a row above the header holds a date range, parse it into `report_start` and `report_end`.
- Drop the rows above the header, and rows whose first cell starts with `Total`.
- Split each metric header at the `_` into device and metric. Ignore any other column, and list it.
- Detect the number format before stripping anything: if values use a decimal comma (`8,33 %`, `1.152,40`), swap the separators first. Then strip thousands separators and currency symbols (`"1,152"` → `1152`) and parse percentages into fractions (`"8.33%"` → `0.0833`). Assert that every Conv. rate lands between 0 and 1. **[DQ]** Report the number format you detected.
- Treat `--` and empty cells as missing. A missing `Impr.`, `Clicks`, `Cost` or `Conversions` is 0. A missing `Conv. rate` or `Avg. CPC` means the hour had no clicks: keep it missing and never fill it with 0. Whenever `Clicks` is 0, treat `Conv. rate` and `Avg. CPC` as missing too, even if the cell says `0`.
- Hours must be whole numbers 0–23. Every device needs all 24 hours: if a device × hour row is absent (exports with `Device` as a row leave out hours with no traffic), add it with `Impr.`, `Clicks`, `Cost` and `Conversions` 0 and the rates missing. **[DQ]** List the hours absent for every device, and count the device × hour rows you filled.
- **[DQ]** Drop every device with 0 impressions across the whole day (usually `Other`), and name it.
**Stop and refuse** if any of these is true:
1. The hour column is missing, or a device with impressions is missing one of the six required metrics.
2. The same hour × device pair appears more than once, which means the export has an extra segment (e.g. `Day` or `Campaign`). In exports with `Device` as a row, each hour repeating once per device is expected, not a duplicate. Report how many duplicate pairs you found.
3. The date range covers more than one day.
4. No device has any impressions left.
5. The headers aren't in English (e.g. `Stunde des Tages`, `Gerät`, `Klicks`, `Kosten`). The report language follows the Google Ads display language, so the recipe below asks for English.
**Don't stop, but flag:**
- **[DQ] Day analysed:** compute the Black Friday of `report_start`'s own year in code (the day after the 4th Thursday of November). If `report_start` is that day, say so. If it's another day, analyse it as a key date and name it. If the file has no date range, label the day `Key date (not stated in file)`.
- **[DQ] Currency:** if `Currency code` has more than one value, flag it.
- **[DQ] Conv. rate check:** compare the exported `Conv. rate` with `Conversions ÷ Clicks` per device × hour, and list any hour where they differ by more than 0.5 pp. If any do, add: `Google's Conv. rate divides by interactions, not clicks; a gap usually means non-click interactions (e.g. video views) in those hours. The analysis uses the exported Conv. rate.`
When you stop, print this recipe with last year's Black Friday date filled in, then wait:
> Set your Google Ads display language to **English** first.
> Google Ads → **Reports → Report editor → + → Table**
> Rows: `Hour of the day`
> Columns: `Device`
> Metrics: `Impr.`, `Conv. rate`, `Avg. CPC`, `Clicks`, `Cost`, `Conversions`
> No other rows, columns or segments.
> Date range: **{last year's BF date}** to **{last year's BF date}** (one day only)
> Download → **.csv** (not Excel .csv), attach it here.
## STEP 2 — Compute (all in code)
**2.1 Devices in scope.** Every device left after Step 1 goes into the heatmaps. A device with under 5% of the day's total impressions is **thin**: it stays in the heatmaps and tables with the class `thin`, but is left out of the analysis. So is a device with 0 clicks, 0 cost or 0 conversions over the whole day, because its shares and indexes would be undefined. **[DQ]** Name each thin device and why.
**[DQ] Single device:** if only one device is left to analyse, skip every cross-device comparison and say so. If none is, skip the Analysis and AI recommendation and say why; the heatmap is still shown.
**Rates come from the file.** Never derive a conv. rate or CPC from Conversions, Clicks or Cost. Use the exported `Conv. rate` and `Avg. CPC`, and combine them across hours only as click-weighted averages, over the hours where the rate isn't missing: `Σ(rate × Clicks) ÷ Σ Clicks`.
**2.2 Device day baselines.** For each device, over the whole day:
- `Conv. rate (day)` = the click-weighted average of the hourly `Conv. rate`
- `Avg. CPC (day)` = the click-weighted average of the hourly `Avg. CPC`
**2.3 Hourly values.** For each device × hour (an hour with 0 clicks gets missing indexes):
- `Impr. share`, `Cost share`, `Conv. share` = the hour's Impr., Cost and Conversions as shares of the device's day
- `CR index` = the hour's `Conv. rate` ÷ Conv. rate (day)
- `CPC index` = the hour's `Avg. CPC` ÷ Avg. CPC (day)
Assert that each of the three shares sums to 100.0% ± 0.1 per device.
**2.4 Three-hour blocks.** Single-hour conv. rates are too noisy to judge, so the analysis reads 8 fixed blocks, written on the 12-hour clock: `12–3 am`, `3–6 am`, `6–9 am`, `9 am–12 pm`, `12–3 pm`, `3–6 pm`, `6–9 pm`, `9 pm–12 am`. Each block holds 3 full hours, so `6–9 pm` covers the hours that start at 6, 7 and 8 pm (export hours 18, 19 and 20). For each device × block, recompute every value in 2.3 for the block: shares from its summed Impr., Cost and Conversions, and its Conv. rate and Avg. CPC as click-weighted averages of its hours. Never average hourly indexes.
A block is **thin** if it has fewer than 50 clicks or fewer than 5 conversions. Thin blocks get no gap labels and can't be a device's best or priciest block. **[DQ]** Report the number of thin blocks per analysed device.
**2.5 Gap labels.** Give each non-thin block of each analysed device every label that applies:
| Label | Rule |
|---|---|
| `Paying more for less` | CPC index ≥ 1.10 and CR index ≤ 0.85 |
| `Volume ahead of conversions` | Impr. share ≥ 15% and CR index ≤ 0.85, or Cost share − Conv. share ≥ +5 pp and CR index ≤ 1.00 |
| `Underused strong hours` | CR index ≥ 1.15, and Impr. share ≤ 10% or CPC index ≤ 0.90 |
| `Possible site issue` | CR index ≤ 0.85 and CPC index < 1.10, while another analysed device has a non-thin block with CR index ≥ 1.00 at the same time |
The first three labels point to pacing; `Possible site issue` points to the site, because conversions drop on one device only and price doesn't explain it.
**2.6 Timing per device.** For each analysed device, with ties going to the earlier block:
- `Half-day hour`: the hour during which the device's cumulative impressions pass 50% of its day (e.g. `1 pm` = passed between 1 and 2 pm).
- `Peak volume block`: the block with the highest Impr. share.
- `Best conv. block`: the non-thin block with the highest CR index.
- `Priciest block`: the non-thin block with the highest CPC index.
**Timing gap:** two analysed devices have one if their half-day hours differ by 2 hours or more, or their peak volume blocks or best conv. blocks differ. Record which of the three differ, for every pair of analysed devices.
## STEP 3 — Output
## OUTPUT SPEC (smec Seasonal Prompt Library · Output Spec v1)
**Format.** One HTML file, light mode only. No external libraries, CDN, web fonts or images. Charts are inline SVG. Build the HTML with your code from the template below. Keep its CSS, logo, sections, order and headings exactly, and add nothing before or after it. Copy the logo `<svg>` character for character. Never type a number into the HTML by hand.
**Delivery.** Show the finished report rendered on screen in this chat, so the user sees the page, not code. Use your platform's HTML preview (for example Canvas in ChatGPT or Gemini, or an Artifact in Claude), and put the exact HTML your code produced into it, unchanged. Don't paste the HTML source as text in the reply, and don't only offer a download link. Only if your platform can't render HTML at all, attach the .html file and say in one line that it opens in any web browser.
**Tone.** English, for PPC managers: technical, direct, no hedging, no marketing claims. Write "smec" in lowercase and "tROAS" with a lowercase t.
**Numbers.**
- Percentages have 1 decimal (`12.4%`), or 2 decimals under 1% (`0.81%`). Changes are in pp: `+3.2 pp`.
- Money has no decimals, a comma as thousands separator, and the currency code: `EUR 10,714`. Amounts under 10 get 2 decimals: `EUR 2.34`.
- Dates are written as `24 Nov 2025`. Weeks are written as their start date.
**Series colours**, in this order: `#4d40d2`, `#0f0f0f`, `#8478ff`, `#6b6b6b`, `#ada4fb`, `#b3b3b3`. Label each line at its right end, in its own colour.
**Highlights.**
- Focus period (e.g. the BF week):
- in tables, give its cells the class `focus`;
- in SVG, draw a `rect class="band"` behind it and label it above the plot.
- Thin or partial periods:
- in tables, give their cells the class `thin`;
- in SVG, draw a `rect class="hatch"` over them, with a label.
**SVG charts.**
- Use `viewBox="0 0 1000 H"` and `width="100%"`. In a grid of small charts (2 per row), use `viewBox="0 0 500 H"` for each chart.
- Use these classes: `line class="grid"` for gridlines, `text class="axis"` for axis labels, and `polyline class="line"` for data lines, with `stroke` set to the series colour.
- Every point is a `<circle r="4">` with a `<title>` holding its value.
- If a y-axis doesn't start at 0, say so in the chart's `.note`.
**Data-quality checks.** One `div class="flag"` per check, one line each. If a check found nothing, say so, e.g. `Thin weeks: none.`
**Template.** Replace the `{…}` placeholders. If there is only one chart, delete the Chart 2 line.
```html
<!DOCTYPE html>
<html lang="en"><head><meta charset="utf-8">
<meta name="viewport" content="width=device-width,initial-scale=1">
<title>{Prompt name} · smec</title>
<style>
body{margin:0;font:15px/1.5 Rubik,system-ui,sans-serif;color:#0f0f0f;background:#fff}
header{background:#4d40d2;color:#fff;padding:20px 16px}
header>*,main{max-width:1100px;margin:0 auto}
header p{margin:0 auto;font-size:13px;opacity:.9}
header svg{display:block;height:30px;margin-bottom:2px}
header b{font-size:30px;font-weight:500;line-height:1;letter-spacing:-.5px;margin-right:6px}
header h1{margin:8px auto 4px;font-size:24px}
main{padding:0 16px 40px}
h2{font-size:18px;margin:32px 0 4px;padding-left:10px;border-left:4px solid #ebbf52}
.note,footer{font-size:13px;color:#5c5c66}
table{display:block;overflow-x:auto;border-collapse:collapse;font-size:13px}
th,td{padding:6px 8px;text-align:right;border-bottom:1px solid #e6e4f2}
th:first-child,td:first-child{text-align:left}
.s1{background:#d8d3ff}.s2{background:#ada4fb}.s3{background:#8478ff}.s4{background:#4d40d2;color:#fff}
.focus{outline:3px solid #ebbf52;outline-offset:-3px}
.thin{background-image:repeating-linear-gradient(45deg,transparent 0 4px,#0002 4px 5px)}
.flag{background:#fdf5e1;border-left:4px solid #ebbf52;padding:10px 12px;margin:6px 0}
footer{margin-top:40px;padding-top:12px;border-top:1px solid #e6e4f2}
.grid{stroke:#e6e4f2}.axis{fill:#5c5c66;font-size:12px}
.band{fill:#ebbf52;fill-opacity:.25}.hatch{fill:url(#hatch)}
.line{fill:none;stroke-width:2.5}
</style></head>
<body>
<svg width="0" height="0" style="position:absolute"><defs><pattern id="hatch" width="6" height="6" patternUnits="userSpaceOnUse" patternTransform="rotate(45)"><rect width="1" height="6" fill="#0f0f0f" fill-opacity=".2"/></pattern></defs></svg>
<header>
<p><svg xmlns="http://www.w3.org/2000/svg" viewBox="0 0 144 151" aria-hidden="true"><linearGradient id="smec-g" x1="1.8" y1="145.2" x2="141.7" y2="5.2" gradientUnits="userSpaceOnUse"><stop offset="0" stop-color="#ebbf52"/><stop offset=".5" stop-color="#ebbf52" stop-opacity=".8"/><stop offset="1" stop-color="#ebbf52" stop-opacity=".1"/></linearGradient><path d="M135.3 1.2q-1.2 0-2.1.4L9.7 51.6a12 12 0 0 0-7.5 11.1v80.5a6 6 0 0 0 6 6q1.2 0 2.3-.4l123.4-50a12 12 0 0 0 7.4-11.1V7.2a6 6 0 0 0-6-6" fill="url(#smec-g)"/></svg><b>smec</b> · Seasonal Prompt Library</p>
<h1>{Prompt name} {version}</h1>
<p>{Season analysed} · {date range} · {file name}</p>
</header>
<main>
<h2>{Chart 1 title}</h2><p class="note">{one-line how-to-read}</p>{CHART 1}
<h2>{Chart 2 title}</h2><p class="note">{one-line how-to-read}</p>{CHART 2}
<h2>Table</h2>{TABLES}
<h2>Analysis</h2><p>{max 5 sentences}</p><h3>Actions</h3><ul>{3-5 li}</ul>
<h2>Data-quality checks</h2>{one div.flag per check}
<footer>Built with the smec Seasonal Prompt Library · {Prompt name} {version} · Run on {today}</footer>
</main>
</body></html>
```
### Prompt-only exceptions to the Output Spec
1. **Hot-cold heatmap.** Don't use the Heatmap module or the `s1`–`s4` classes. Colour each heatmap column (one device × one metric, 24 hours) on its own scale, in code:
- Find the column's min and max, skipping missing values. For `Conv. rate` and `Avg. CPC`, also skip hours with fewer than 10 clicks. Those cells print their value but stay uncoloured.
- `t = (value − min) / (max − min)`. If min = max, `t = 0.5`.
- If `t < 0.5`, blend `#4d40d2` into `#ffffff` by `t ÷ 0.5`. Otherwise blend `#ffffff` into `#ebbf52` by `(t − 0.5) ÷ 0.5`. Round each RGB channel, and set the hex as the cell's inline `style="background-color:#rrggbb"`.
- If the blended colour is dark (`0.299·R + 0.587·G + 0.114·B < 140`), also add `color:#fff` to that cell's style so the number stays readable.
2. **Inline styles** are allowed only for heatmap cell backgrounds and their white text, the legend swatch, and `border-left:2px solid #e6e4f2` on the first column of each column group.
3. **No Actions list.** Replace `<h3>Actions</h3><ul>{3-5 li}</ul>` with the AI recommendation paragraph described below.
4. **Currency in headers.** Avg. CPC and Cost cells print the number only (Avg. CPC always with 2 decimals). The currency code goes in the column header, e.g. `Avg. CPC (EUR)`.
5. **No SVG charts.** This report has no line charts, series colours or weekly periods. Ignore those parts of the Output Spec, and draw nothing that isn't described below.
6. **Working data, collapsed.** Insert one extra section between the Analysis and `Data-quality checks`: `<h2>Working data</h2><details><summary>Blocks by device and hourly helper data</summary>{WORKING TABLES}</details>`. It stays closed by default.
### What goes in the template slots
**Header.** `{Prompt name} {version}` = `Black Friday By the Hour v1`. `{Season analysed}` = `Black Friday {YYYY} ({date})`, or `Key date ({date})` if the day isn't Black Friday, or `Key date (not stated in file)`. `{date range}` = the day.
**Labels everywhere.** Use the 12-hour clock throughout, converted in code from the export's 0–23 hours: hours are written `12 am`, `1 am` … `11 am`, `12 pm`, `1 pm` … `11 pm` (export hour 0 = `12 am`, 12 = `12 pm`), and blocks as in 2.4 (`6–9 pm`). Devices are ordered by day impressions, highest first. A thin device gets ` (thin)` after its name and the class `thin` on all its cells.
**Chart 1 — hourly heatmap.** One HTML `<table>`.
- Title: `Hourly heatmap by device`
- Note: `Hours in the account's time zone. Each column has its own scale: read timing down a column, not values across columns.`
- Header row 1: an empty cell, then `Impr.`, `Conv. rate` and `Avg. CPC ({currency})`, each spanning one column per device. Header row 2: `Hour`, then the device names, in the same order inside each group.
- 24 rows. Cells print `Impr.` with a thousands separator, `Conv. rate` as a percentage, `Avg. CPC` with 2 decimals, or `—` if missing. Colour them as in exception 1.
- Directly under the table, this tiny legend, word for word:
`<p class="note"><span style="display:inline-block;width:48px;height:8px;background:linear-gradient(90deg,#4d40d2,#fff,#ebbf52);vertical-align:middle"></span> Hot-cold scale per column: blue = lowest hour, gold = highest; high is not good or bad. Uncoloured: Conv. rate and Avg. CPC in hours under 10 clicks.</p>`
**Chart 2 — gap map.** One HTML `<table>`.
- Title: `Gaps by 3-hour block`
- Note: `Pacing gaps: Paying more for less, Volume ahead of conversions, Underused strong hours. Site gap: Possible site issue. Indexes compare each block to the device's own day.`
- Rows are the 8 blocks. Columns are the analysed devices only.
- A labelled cell gets the class `focus` and lists its labels, one per line, then one `<span class="note">` line: `CR {x}× · CPC {x}× · Impr. {x}% · Cost − Conv. {±x} pp`.
- A thin block prints `thin` with the class `thin`. Any other block prints `—`.
**Tables:** one table, with the `<h3>` heading `Timing by device`.
- Rows: `Half-day hour`, `Peak volume block`, `Best conv. block`, `Priciest block`. Columns: the analysed devices.
- Below it, one `<p class="note">` per device pair: `Timing gap, {A} vs. {B}: {what differs} differ.` or `No timing gap between {A} and {B}.`
**Analysis.** At most 5 sentences, and every number from Step 2. Cover, in this order:
- the timing between devices: half-day hours, peak volume blocks and best conv. blocks, or that there's no timing gap;
- the labelled blocks, biggest first by absolute block cost (across devices), each with the device, the hours and the indexes that triggered its label;
- which of them point to pacing and which to the site.
If no block is labelled, say so in one sentence.
**AI recommendation**, in place of Actions: `<p><b>AI recommendation (evaluate by human):</b> {1–2 sentences}</p>`
- Name the biggest pacing gap (highest absolute block cost) and, if the same device has an `Underused strong hours` block, where its weight could go instead.
- If there is a `Possible site issue`, name the device, the hours and the date to check on the site.
- Direction only: no amounts, and no bid, budget or tROAS figures.
**Working data** (exception 6): two tables inside the `<details>`, each with an `<h3>` heading.
1. `Blocks by device`
- Rows are the blocks. One column group per analysed device: `Impr. share`, `CR index`, `CPC index`, `Cost share`, `Conv. share`, `Cost − Conv.`
- Indexes as `0.72×`, shares as percentages, the gap in pp. Thin blocks get the class `thin`.
2. `Hourly helper data`
- No colour. Rows are the 24 hours. One column group per device, thin devices included: `Clicks`, `Cost ({currency})`, `Conversions` (2 decimals).
## NEVER
- Never continue past a Step 1 failure.
- Never pool devices into one total, or compare anything without its device.
- Never treat a single hour's conv. rate as a finding. Findings come from blocks.
- Never label a thin block, or analyse a thin device.
- Never compare to benchmarks or "typical" accounts. You only have this file.
- Never recommend amounts, bids, budgets or tROAS targets, and never write recommendations outside the one AI recommendation paragraph.
- Never write more than 5 sentences in the Analysis paragraph, or more than 2 in the AI recommendation.
How do I run it?
Export your data
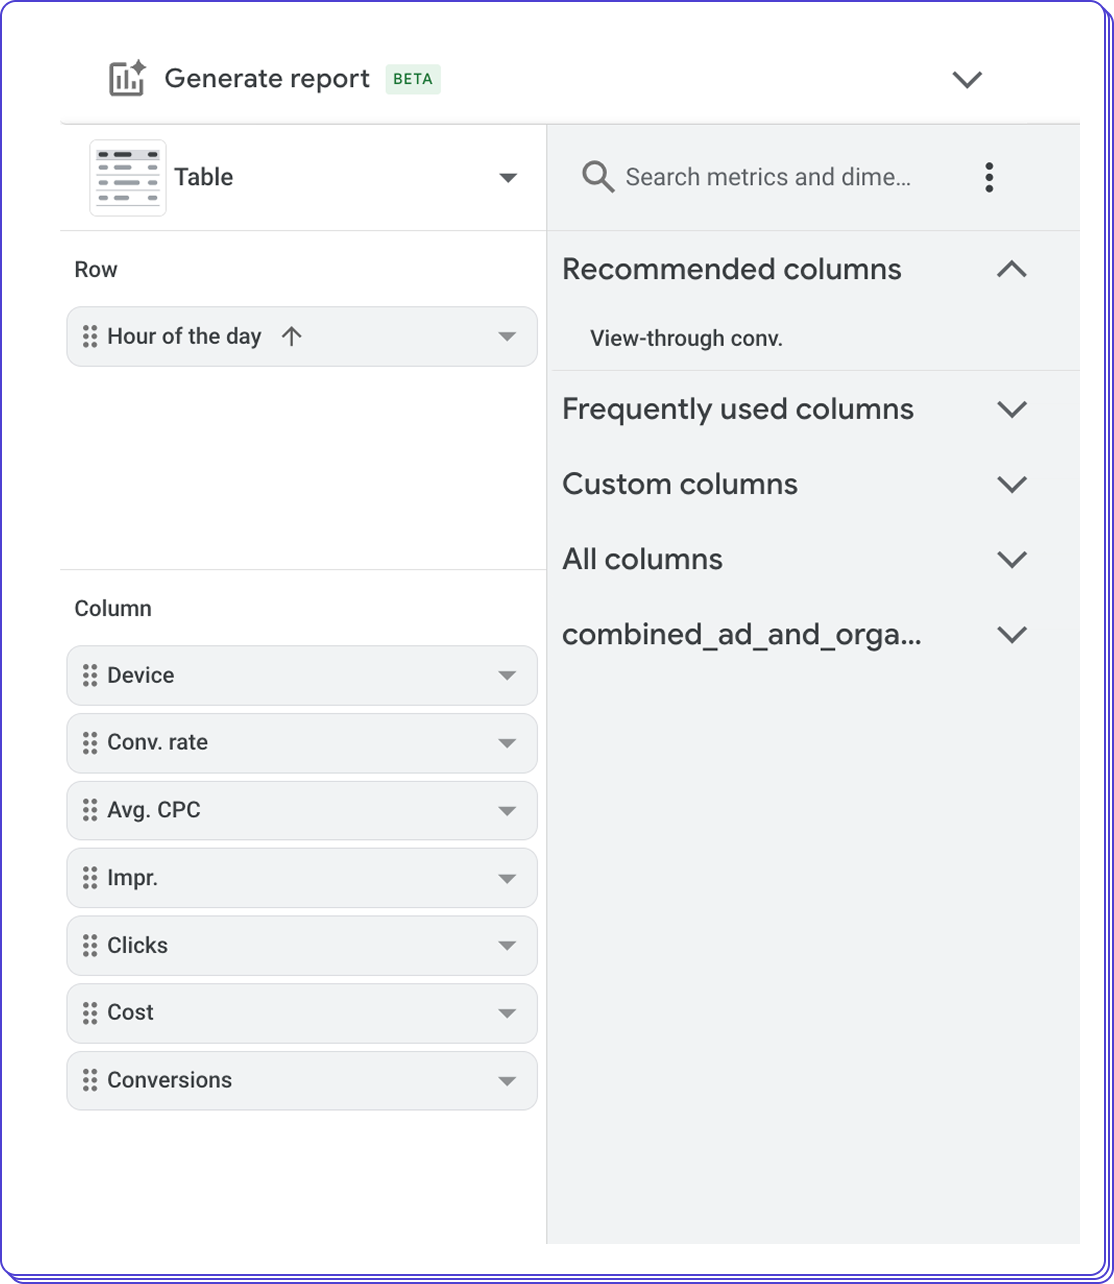
In Google Ads, go to Insights and Reports → Report editor → + → Table. Add the row Hour of the day and the column Device, with the metrics Impr., Conv. rate, Avg. CPC, Clicks, Cost and Conversions. Don’t add other rows or segments. To review one campaign type or campaign only, use a filter. Set the date range to a single day: 28 Nov – 28 Nov 2025 for last Black Friday, or any other key date. Then download it as .csv.
Open an AI tool that can run code
For example: ChatGPT, Claude, Gemini or Google Antigravity. We recommend a paid plan so your chats aren’t used for training.
Paste the prompt and attach your CSV
Give it a moment. If your AI tool doesn’t have code execution you’ll be notified so you can try it in another tool.
Get your report
An hourly heatmap per device, a map of the 3-hour blocks where cost and conversions didn’t line up, a timing table per device, and one AI recommendation for you to review.
How to build the export report
in Google Ads
Reading your report
Check whether your bids or budget pushed hardest when your traffic converted least.
Check whether budget ran out or pacing held you back in those hours. Early mornings are a common case.
toward the blocks where conversions
kept up with spend.
on that device in those hours,
on that date.
for example with campaign splits, as long as each one has enough conversion volume.
Check whether your bids or budget pushed hardest when your traffic converted least.
Check whether budget ran out or pacing held you back in those hours. Early mornings are a common case.
toward the blocks where conversions
kept up with spend.
on that device in those hours,
on that date.
for example with campaign splits, as long as each one has enough conversion volume.
Before you run it

One day per run. If your export covers more than one day, or has an extra row like Campaign or Day, the prompt stops and shows you the export recipe.
Findings come from 3-hour blocks, not single hours. Blocks with under 50 clicks or 5 conversions, and devices under 5% of impressions, are shown but not analysed.
The prompt reads conversions and conv. rate, not conversion value. It doesn’t show revenue or ROAS. Hours are in your account’s time zone.
Your export holds hourly totals per device, not customer-level data. Use a paid plan of
your AI tool.
Got this
from a colleague?
Get all 5 Black Friday prompts,
one per weekday.