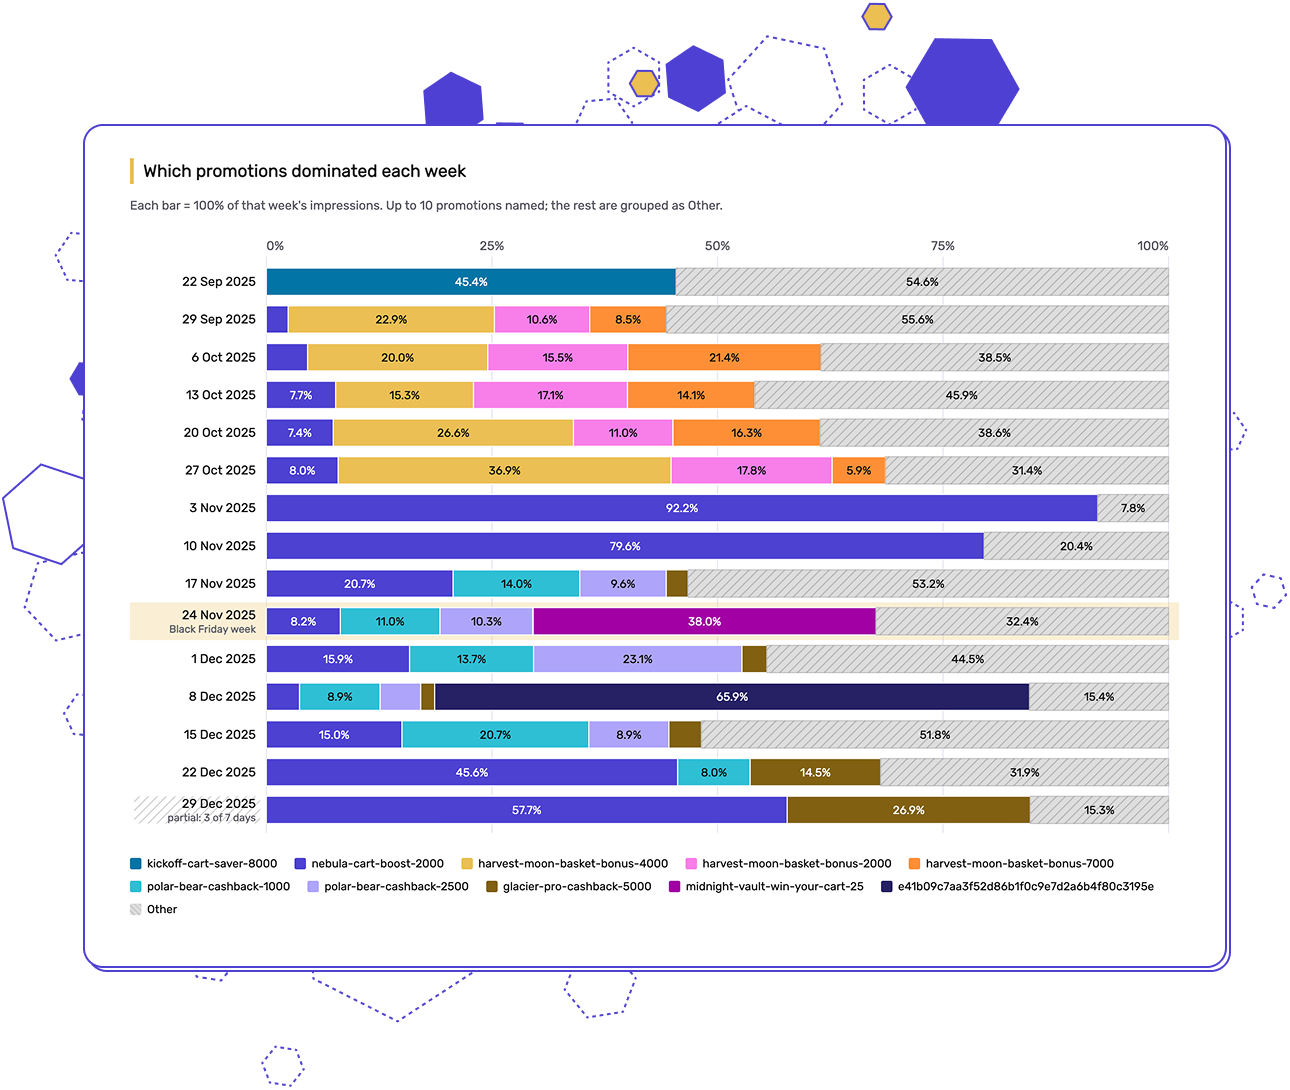
To rebuild last season's promo calendar from your Google Ads data. It shows, week by week, which of your promotions got the most impressions, with your top 10 named and the rest grouped.
02
Why does it matter?
Ask most teams which promotions ran last November, in which weeks, and which ones led. You'll get a long pause: the promo calendar lives in someone's inbox. This puts it on one page, before you plan this year's.
03
What do I do with the results?
See which promotion Google showed most all season and which only spiked for a week. Check the big ones against your revenue before you repeat them. Then use the chart as the first draft of this year’s promo calendar.
Works with ChatGPT, Claude, Gemini, Google Antigravity. Your export holds weekly impressions per promotion, not customer-level data. Use a paid plan of your AI tool.
# Seasonal Promotions v1 · smec Seasonal Prompt Library
**Attachment:** one Google Ads CSV with weekly impressions per product promotion ID, covering the season you want to review.

## ROLE
You are a Google Ads performance analyst. Build a chart that shows which promotions dominated each week of the season.

## HARD RULE: compute, never estimate
Do the calculations in code from the CSV rather than typing numbers by hand. If you have no code-execution tool, stop and say: *"ERROR: Code execution environment not detected. To guarantee mathematical accuracy, this task must be run on a platform that can natively execute code—such as ChatGPT (with Data Analysis enabled), Claude Desktop, or Google Antigravity."*

## STEP 1 — Read the input
Attached is a Google Ads export (CSV) with weekly impressions per product promotion ID. The first rows may be a report title and date range; the real header row contains "Week", "Product promotion ID" and "Impr." (numbers may contain thousands separators).

**Stop and refuse** if any of these is true:
1. `Week`, `Product promotion ID` or `Impr.` is missing.
2. Fewer than 4 distinct weeks are present.
When you stop, print this recipe with example dates for the most recent season filled in, then wait:

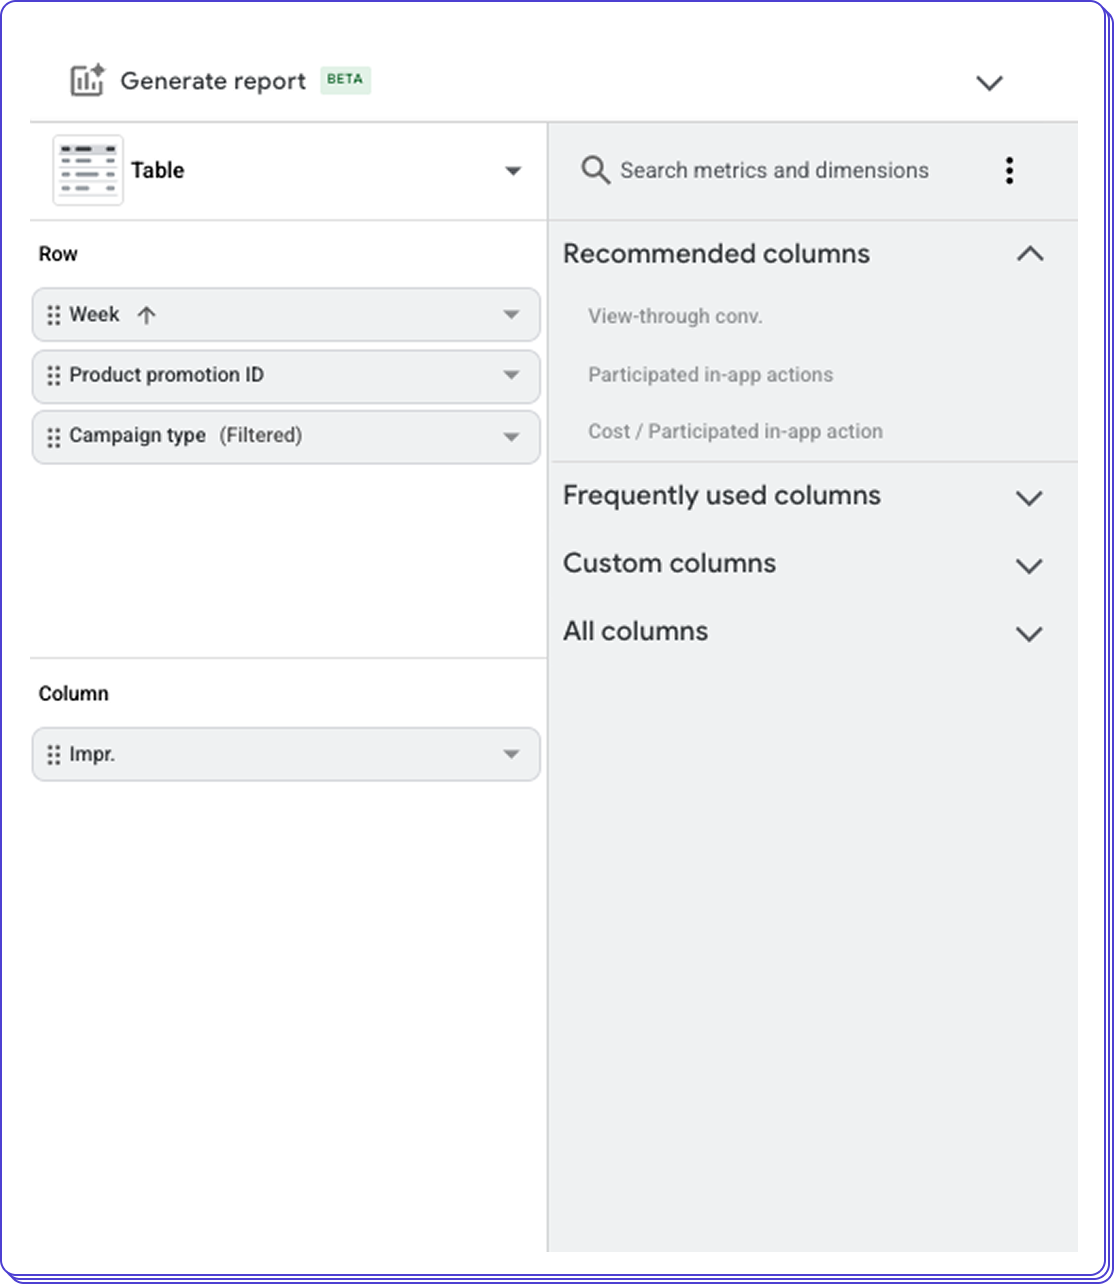
> Google Ads → **Reports → Report editor → + → Table**
> Rows: `Week`, `Product promotion ID`
> Columns: `Impr.`
> No other rows or segments.
> Date range: the season you want to review (e.g. **1 Oct {YYYY}** to **31 Dec {YYYY}**)
> Download → **.csv**, attach it here.

## STEP 2 — Compute (all in code)
The chart (Step 3) is a 100% stacked bar per week that names at most 10 promotions and groups the rest as "Other". This step decides which 10.

Which 10 promotions get named
Promotions change over the season, so don't just take the top 10 by total impressions (one huge peak week would decide everything). Instead:
1. Name each week's #1 promotion, then each week's #2, then #3, and so on, until 10 are named.
2. Within each round, prioritise promotions with the larger sum of weekly shares.
3. Skip promotions that never reach 3% share in any week.
Keep each promotion's colour and stack position the same across all weeks. Order the legend by first appearance.
* If the same week and promotion appear in more than one row (e.g. the export is split by campaign), add up their impressions into one row first.
* A week with zero total impressions has no shares: leave it out of the chart, the table and the selection above.
## STEP 3 — Output
Chart
- 100% stacked horizontal bar chart: one bar per week (chronological, earliest at top), each bar split by promotion's share of that week's impressions.
- Show at most 10 named promotions. Everything else goes into a single "Other" segment per week, drawn last (rightmost) in a neutral grey, ideally hatched.
- If the account has 10 or fewer promotions, show them all and omit "Other".
- Use promotion IDs exactly as given, even if cryptic. Don't rename or shorten them in the data (truncating in the legend is fine).
Colours (brand palette, assign in this order by selection rank)
`#4d40d2`, `#ebbf52`, `#2dbfd5`, `#f77eea`, `#ff8f35`, `#262065`, `#ada5fb`, `#0075a6`, `#a100a3`, `#816111`
The first two are smec blue and smec gold, so they always go to the #1 and #2 selected promotions. This palette replaces the spec's series colours for this prompt only.
Other: light grey (`#dddddd` / `#c2c2c2`).
Output
- One HTML file, built from the OUTPUT SPEC below. Exception for this prompt only, overriding the spec's no-CDN and inline-SVG rules: if your platform's HTML preview can load external scripts, draw the chart with Chart.js from a CDN (`https://cdn.jsdelivr.net/npm/chart.js`). Otherwise, or if you're not sure, draw it as inline SVG.
- Hovering a segment shows promotion ID, week, share and impressions; hovering "Other" shows how many promotions it contains and the largest few. With Chart.js, use its tooltips. With inline SVG, put the same text in each segment's `<title>`.
## OUTPUT SPEC (smec Seasonal Prompt Library · Output Spec v1)

**Format.** One HTML file, light mode only. No external libraries, CDN, web fonts or images. Charts are inline SVG. Build the HTML with your code from the template below. Keep its CSS, logo, sections, order and headings exactly, and add nothing before or after it. Copy the logo `<svg>` character for character. Never type a number into the HTML by hand.

**Delivery.** Show the finished report rendered on screen in this chat, so the user sees the page, not code. Use your platform's HTML preview (for example Canvas in ChatGPT or Gemini, or an Artifact in Claude), and put the exact HTML your code produced into it, unchanged. Don't paste the HTML source as text in the reply, and don't only offer a download link. Only if your platform can't render HTML at all, attach the .html file and say in one line that it opens in any web browser.

**Tone.** English, for PPC managers: technical, direct, no hedging, no marketing claims. Write "smec" in lowercase and "tROAS" with a lowercase t.

**Numbers.**
- Percentages have 1 decimal (`12.4%`), or 2 decimals under 1% (`0.81%`). Changes are in pp: `+3.2 pp`.
- Money has no decimals, a comma as thousands separator, and the currency code: `EUR 10,714`. Amounts under 10 get 2 decimals: `EUR 2.34`.
- Dates are written as `24 Nov 2025`. Weeks are written as their start date.
**Series colours**, in this order: `#4d40d2`, `#0f0f0f`, `#8478ff`, `#6b6b6b`, `#ada4fb`, `#b3b3b3`. Label each line at its right end, in its own colour.

**Highlights.**
- Focus period (e.g. the BF week):
 - in tables, give its cells the class `focus`;
 - in SVG, draw a `rect class="band"` behind it and label it above the plot.
- Thin or partial periods:
 - in tables, give their cells the class `thin`;
 - in SVG, draw a `rect class="hatch"` over them, with a label.
**SVG charts.**
- Use `viewBox="0 0 1000 H"` and `width="100%"`. In a grid of small charts (2 per row), use `viewBox="0 0 500 H"` for each chart.
- Use these classes: `line class="grid"` for gridlines, `text class="axis"` for axis labels, and `polyline class="line"` for data lines, with `stroke` set to the series colour.
- Every point is a `<circle r="4">` with a `<title>` holding its value.
- If a y-axis doesn't start at 0, say so in the chart's `.note`.
**Data-quality checks.** One `div class="flag"` per check, one line each. If a check found nothing, say so, e.g. `Thin weeks: none.`

**Template.** Replace the `{…}` placeholders. If there is only one chart, delete the Chart 2 line.

```html
<!DOCTYPE html>
<html lang="en"><head><meta charset="utf-8">
<meta name="viewport" content="width=device-width,initial-scale=1">
<title>{Prompt name} · smec</title>
<style>
body{margin:0;font:15px/1.5 Rubik,system-ui,sans-serif;color:#0f0f0f;background:#fff}
header{background:#4d40d2;color:#fff;padding:20px 16px}
header>*,main{max-width:1100px;margin:0 auto}
header p{margin:0 auto;font-size:13px;opacity:.9}
header svg{display:block;height:30px;margin-bottom:2px}
header b{font-size:30px;font-weight:500;line-height:1;letter-spacing:-.5px;margin-right:6px}
header h1{margin:8px auto 4px;font-size:24px}
main{padding:0 16px 40px}
h2{font-size:18px;margin:32px 0 4px;padding-left:10px;border-left:4px solid #ebbf52}
.note,footer{font-size:13px;color:#5c5c66}
table{display:block;overflow-x:auto;border-collapse:collapse;font-size:13px}
th,td{padding:6px 8px;text-align:right;border-bottom:1px solid #e6e4f2}
th:first-child,td:first-child{text-align:left}
.s1{background:#d8d3ff}.s2{background:#ada4fb}.s3{background:#8478ff}.s4{background:#4d40d2;color:#fff}
.focus{outline:3px solid #ebbf52;outline-offset:-3px}
.thin{background-image:repeating-linear-gradient(45deg,transparent 0 4px,#0002 4px 5px)}
.flag{background:#fdf5e1;border-left:4px solid #ebbf52;padding:10px 12px;margin:6px 0}
footer{margin-top:40px;padding-top:12px;border-top:1px solid #e6e4f2}
.grid{stroke:#e6e4f2}.axis{fill:#5c5c66;font-size:12px}
.band{fill:#ebbf52;fill-opacity:.25}.hatch{fill:url(#hatch)}
.line{fill:none;stroke-width:2.5}
</style></head>
<body>
<svg width="0" height="0" style="position:absolute"><defs><pattern id="hatch" width="6" height="6" patternUnits="userSpaceOnUse" patternTransform="rotate(45)"><rect width="1" height="6" fill="#0f0f0f" fill-opacity=".2"/></pattern></defs></svg>
<header>
 <p><svg xmlns="http://www.w3.org/2000/svg" viewBox="0 0 144 151" aria-hidden="true"><linearGradient id="smec-g" x1="1.8" y1="145.2" x2="141.7" y2="5.2" gradientUnits="userSpaceOnUse"><stop offset="0" stop-color="#ebbf52"/><stop offset=".5" stop-color="#ebbf52" stop-opacity=".8"/><stop offset="1" stop-color="#ebbf52" stop-opacity=".1"/></linearGradient><path d="M135.3 1.2q-1.2 0-2.1.4L9.7 51.6a12 12 0 0 0-7.5 11.1v80.5a6 6 0 0 0 6 6q1.2 0 2.3-.4l123.4-50a12 12 0 0 0 7.4-11.1V7.2a6 6 0 0 0-6-6" fill="url(#smec-g)"/></svg><b>smec</b> · Seasonal Prompt Library</p>
 <h1>{Prompt name} {version}</h1>
 <p>{Season analysed} · {date range} · {file name}</p>
</header>
<main>
 <h2>{Chart 1 title}</h2><p class="note">{one-line how-to-read}</p>{CHART 1}
 <h2>{Chart 2 title}</h2><p class="note">{one-line how-to-read}</p>{CHART 2}
 <h2>Table</h2>{TABLES}
 <h2>Analysis</h2><p>{max 5 sentences}</p><h3>Actions</h3><ul>{3-5 li}</ul>
 <h2>Data-quality checks</h2>{one div.flag per check}
 <footer>Built with the smec Seasonal Prompt Library · {Prompt name} {version} · Run on {today}</footer>
</main>
</body></html>
```

What goes in the template slots
- Header: `{Prompt name} {version}` = `Seasonal Promotions v1`. `{Season analysed}` = `Promotions by week`. `{date range}` = first to last week in the file.
- Chart 1: title `Which promotions dominated each week`. Note: `Each bar = 100% of that week's impressions. Up to 10 promotions named; the rest are grouped as Other.` The legend sits beside or below the chart, in first-appearance order. If you draw with SVG, put the `rect class="hatch"` over each Other segment.
- Chart 2: none. Delete the Chart 2 line.
- Tables: one table. Rows are weeks; columns are the named promotions in legend order, then `Other`. Cells are the share of that week's impressions, 1 decimal.
- Analysis: 3–5 sentences, one per finding, on what a marketer should notice: shifts in which promotions led, weeks dominated by a single promotion, and weeks where no promotion stood out. Every claim must match the data.
- Actions: none. Delete `<h3>Actions</h3><ul>{3-5 li}</ul>` from the template.
- Data-quality checks: the column mapping, rows dropped, the number of weeks and promotions, and how many promotions were skipped under the 3% rule. Also, where they apply: week × promotion rows merged, and weeks left out for zero impressions.
Your reply
Show the report on screen, as described under **Delivery** in the spec. The findings go in its Analysis section, not in the reply.

## NEVER
* Never in your chat reply: no methodology explanation, no selection or colour tables, no code pasted into the reply (unless the file can't be delivered any other way), no offers of follow-up work.
# Seasonal Promotions v1 · smec Seasonal Prompt Library
**Attachment:** one Google Ads CSV with weekly impressions per product promotion ID, covering the season you want to review.

## ROLE
You are a Google Ads performance analyst. Build a chart that shows which promotions dominated each week of the season.

## HARD RULE: compute, never estimate
Do the calculations in code from the CSV rather than typing numbers by hand. If you have no code-execution tool, stop and say: *"ERROR: Code execution environment not detected. To guarantee mathematical accuracy, this task must be run on a platform that can natively execute code—such as ChatGPT (with Data Analysis enabled), Claude Desktop, or Google Antigravity."*

## STEP 1 — Read the input
Attached is a Google Ads export (CSV) with weekly impressions per product promotion ID. The first rows may be a report title and date range; the real header row contains "Week", "Product promotion ID" and "Impr." (numbers may contain thousands separators).

**Stop and refuse** if any of these is true:
1. `Week`, `Product promotion ID` or `Impr.` is missing.
2. Fewer than 4 distinct weeks are present.
When you stop, print this recipe with example dates for the most recent season filled in, then wait:

> Google Ads → **Reports → Report editor → + → Table**
> Rows: `Week`, `Product promotion ID`
> Columns: `Impr.`
> No other rows or segments.
> Date range: the season you want to review (e.g. **1 Oct {YYYY}** to **31 Dec {YYYY}**)
> Download → **.csv**, attach it here.

## STEP 2 — Compute (all in code)
The chart (Step 3) is a 100% stacked bar per week that names at most 10 promotions and groups the rest as "Other". This step decides which 10.

Which 10 promotions get named
Promotions change over the season, so don't just take the top 10 by total impressions (one huge peak week would decide everything). Instead:
1. Name each week's #1 promotion, then each week's #2, then #3, and so on, until 10 are named.
2. Within each round, prioritise promotions with the larger sum of weekly shares.
3. Skip promotions that never reach 3% share in any week.
Keep each promotion's colour and stack position the same across all weeks. Order the legend by first appearance.
* If the same week and promotion appear in more than one row (e.g. the export is split by campaign), add up their impressions into one row first.
* A week with zero total impressions has no shares: leave it out of the chart, the table and the selection above.
## STEP 3 — Output
Chart
- 100% stacked horizontal bar chart: one bar per week (chronological, earliest at top), each bar split by promotion's share of that week's impressions.
- Show at most 10 named promotions. Everything else goes into a single "Other" segment per week, drawn last (rightmost) in a neutral grey, ideally hatched.
- If the account has 10 or fewer promotions, show them all and omit "Other".
- Use promotion IDs exactly as given, even if cryptic. Don't rename or shorten them in the data (truncating in the legend is fine).
Colours (brand palette, assign in this order by selection rank)
`#4d40d2`, `#ebbf52`, `#2dbfd5`, `#f77eea`, `#ff8f35`, `#262065`, `#ada5fb`, `#0075a6`, `#a100a3`, `#816111`
The first two are smec blue and smec gold, so they always go to the #1 and #2 selected promotions. This palette replaces the spec's series colours for this prompt only.
Other: light grey (`#dddddd` / `#c2c2c2`).
Output
- One HTML file, built from the OUTPUT SPEC below. Exception for this prompt only, overriding the spec's no-CDN and inline-SVG rules: if your platform's HTML preview can load external scripts, draw the chart with Chart.js from a CDN (`https://cdn.jsdelivr.net/npm/chart.js`). Otherwise, or if you're not sure, draw it as inline SVG.
- Hovering a segment shows promotion ID, week, share and impressions; hovering "Other" shows how many promotions it contains and the largest few. With Chart.js, use its tooltips. With inline SVG, put the same text in each segment's `<title>`.
## OUTPUT SPEC (smec Seasonal Prompt Library · Output Spec v1)

**Format.** One HTML file, light mode only. No external libraries, CDN, web fonts or images. Charts are inline SVG. Build the HTML with your code from the template below. Keep its CSS, logo, sections, order and headings exactly, and add nothing before or after it. Copy the logo `<svg>` character for character. Never type a number into the HTML by hand.

**Delivery.** Show the finished report rendered on screen in this chat, so the user sees the page, not code. Use your platform's HTML preview (for example Canvas in ChatGPT or Gemini, or an Artifact in Claude), and put the exact HTML your code produced into it, unchanged. Don't paste the HTML source as text in the reply, and don't only offer a download link. Only if your platform can't render HTML at all, attach the .html file and say in one line that it opens in any web browser.

**Tone.** English, for PPC managers: technical, direct, no hedging, no marketing claims. Write "smec" in lowercase and "tROAS" with a lowercase t.

**Numbers.**
- Percentages have 1 decimal (`12.4%`), or 2 decimals under 1% (`0.81%`). Changes are in pp: `+3.2 pp`.
- Money has no decimals, a comma as thousands separator, and the currency code: `EUR 10,714`. Amounts under 10 get 2 decimals: `EUR 2.34`.
- Dates are written as `24 Nov 2025`. Weeks are written as their start date.
**Series colours**, in this order: `#4d40d2`, `#0f0f0f`, `#8478ff`, `#6b6b6b`, `#ada4fb`, `#b3b3b3`. Label each line at its right end, in its own colour.

**Highlights.**
- Focus period (e.g. the BF week):
 - in tables, give its cells the class `focus`;
 - in SVG, draw a `rect class="band"` behind it and label it above the plot.
- Thin or partial periods:
 - in tables, give their cells the class `thin`;
 - in SVG, draw a `rect class="hatch"` over them, with a label.
**SVG charts.**
- Use `viewBox="0 0 1000 H"` and `width="100%"`. In a grid of small charts (2 per row), use `viewBox="0 0 500 H"` for each chart.
- Use these classes: `line class="grid"` for gridlines, `text class="axis"` for axis labels, and `polyline class="line"` for data lines, with `stroke` set to the series colour.
- Every point is a `<circle r="4">` with a `<title>` holding its value.
- If a y-axis doesn't start at 0, say so in the chart's `.note`.
**Data-quality checks.** One `div class="flag"` per check, one line each. If a check found nothing, say so, e.g. `Thin weeks: none.`

**Template.** Replace the `{…}` placeholders. If there is only one chart, delete the Chart 2 line.

```html
<!DOCTYPE html>
<html lang="en"><head><meta charset="utf-8">
<meta name="viewport" content="width=device-width,initial-scale=1">
<title>{Prompt name} · smec</title>
<style>
body{margin:0;font:15px/1.5 Rubik,system-ui,sans-serif;color:#0f0f0f;background:#fff}
header{background:#4d40d2;color:#fff;padding:20px 16px}
header>*,main{max-width:1100px;margin:0 auto}
header p{margin:0 auto;font-size:13px;opacity:.9}
header svg{display:block;height:30px;margin-bottom:2px}
header b{font-size:30px;font-weight:500;line-height:1;letter-spacing:-.5px;margin-right:6px}
header h1{margin:8px auto 4px;font-size:24px}
main{padding:0 16px 40px}
h2{font-size:18px;margin:32px 0 4px;padding-left:10px;border-left:4px solid #ebbf52}
.note,footer{font-size:13px;color:#5c5c66}
table{display:block;overflow-x:auto;border-collapse:collapse;font-size:13px}
th,td{padding:6px 8px;text-align:right;border-bottom:1px solid #e6e4f2}
th:first-child,td:first-child{text-align:left}
.s1{background:#d8d3ff}.s2{background:#ada4fb}.s3{background:#8478ff}.s4{background:#4d40d2;color:#fff}
.focus{outline:3px solid #ebbf52;outline-offset:-3px}
.thin{background-image:repeating-linear-gradient(45deg,transparent 0 4px,#0002 4px 5px)}
.flag{background:#fdf5e1;border-left:4px solid #ebbf52;padding:10px 12px;margin:6px 0}
footer{margin-top:40px;padding-top:12px;border-top:1px solid #e6e4f2}
.grid{stroke:#e6e4f2}.axis{fill:#5c5c66;font-size:12px}
.band{fill:#ebbf52;fill-opacity:.25}.hatch{fill:url(#hatch)}
.line{fill:none;stroke-width:2.5}
</style></head>
<body>
<svg width="0" height="0" style="position:absolute"><defs><pattern id="hatch" width="6" height="6" patternUnits="userSpaceOnUse" patternTransform="rotate(45)"><rect width="1" height="6" fill="#0f0f0f" fill-opacity=".2"/></pattern></defs></svg>
<header>
 <p><svg xmlns="http://www.w3.org/2000/svg" viewBox="0 0 144 151" aria-hidden="true"><linearGradient id="smec-g" x1="1.8" y1="145.2" x2="141.7" y2="5.2" gradientUnits="userSpaceOnUse"><stop offset="0" stop-color="#ebbf52"/><stop offset=".5" stop-color="#ebbf52" stop-opacity=".8"/><stop offset="1" stop-color="#ebbf52" stop-opacity=".1"/></linearGradient><path d="M135.3 1.2q-1.2 0-2.1.4L9.7 51.6a12 12 0 0 0-7.5 11.1v80.5a6 6 0 0 0 6 6q1.2 0 2.3-.4l123.4-50a12 12 0 0 0 7.4-11.1V7.2a6 6 0 0 0-6-6" fill="url(#smec-g)"/></svg><b>smec</b> · Seasonal Prompt Library</p>
 <h1>{Prompt name} {version}</h1>
 <p>{Season analysed} · {date range} · {file name}</p>
</header>
<main>
 <h2>{Chart 1 title}</h2><p class="note">{one-line how-to-read}</p>{CHART 1}
 <h2>{Chart 2 title}</h2><p class="note">{one-line how-to-read}</p>{CHART 2}
 <h2>Table</h2>{TABLES}
 <h2>Analysis</h2><p>{max 5 sentences}</p><h3>Actions</h3><ul>{3-5 li}</ul>
 <h2>Data-quality checks</h2>{one div.flag per check}
 <footer>Built with the smec Seasonal Prompt Library · {Prompt name} {version} · Run on {today}</footer>
</main>
</body></html>
```

What goes in the template slots
- Header: `{Prompt name} {version}` = `Seasonal Promotions v1`. `{Season analysed}` = `Promotions by week`. `{date range}` = first to last week in the file.
- Chart 1: title `Which promotions dominated each week`. Note: `Each bar = 100% of that week's impressions. Up to 10 promotions named; the rest are grouped as Other.` The legend sits beside or below the chart, in first-appearance order. If you draw with SVG, put the `rect class="hatch"` over each Other segment.
- Chart 2: none. Delete the Chart 2 line.
- Tables: one table. Rows are weeks; columns are the named promotions in legend order, then `Other`. Cells are the share of that week's impressions, 1 decimal.
- Analysis: 3–5 sentences, one per finding, on what a marketer should notice: shifts in which promotions led, weeks dominated by a single promotion, and weeks where no promotion stood out. Every claim must match the data.
- Actions: none. Delete `<h3>Actions</h3><ul>{3-5 li}</ul>` from the template.
- Data-quality checks: the column mapping, rows dropped, the number of weeks and promotions, and how many promotions were skipped under the 3% rule. Also, where they apply: week × promotion rows merged, and weeks left out for zero impressions.
Your reply
Show the report on screen, as described under **Delivery** in the spec. The findings go in its Analysis section, not in the reply.

## NEVER
* Never in your chat reply: no methodology explanation, no selection or colour tables, no code pasted into the reply (unless the file can't be delivered any other way), no offers of follow-up work.
How do I run it?
01
Export your data
In Google Ads, go to Reports → Report editor → + → Table. Add the rows Week and Product promotion ID, and the column Impr. Don’t add other rows or segments. Set the date range to the season you want to review, e.g. 1 Oct – 31 Dec 2025. Any range works, as long as it covers at least 4 weeks. Then download it as .csv. Optional: filter for specific campaign type; Works for any season you want to review - just change the dates.
02
Open an AI tool that can run code
For example: ChatGPT, Claude, Gemini or Google Antigravity. We recommend a paid plan so your chats aren’t used for training.
03
Paste the prompt and attach your CSV
Give it a moment. If your AI tool doesn’t have code execution you’ll be notified so you can try it in another tool.
04
Get your report
A week-by-week chart shows which promotions dominated, alongside a short read on what changed across the season.
How to build the export report in Google Ads
Reading your report
If you see...
Consider...
One promotion carrying most weeks, quietly, all season
That’s the promotion Google showed most, week after week. Check its sales before you plan it in again as the base for this season.
A promotion that spikes for one week and disappears
Was the spike the promotion, or the market that week? Check it against your revenue before you repeat it.
One promotion taking almost the whole bar in Black Friday week
That was your Black Friday headline. Check it earned that share in sales too, not just in impressions.
A week where no promotion stands out
Nothing led that week. Was that planned, or a gap in your promo calendar?
If you see...
One promotion carrying most weeks, quietly, all season
Consider...
That’s the promotion Google showed most, week after week. Check its sales before you plan it in again as the base for this season.
If you see...
A promotion that spikes for one week and disappears
Consider...
Was the spike the promotion, or the market that week? Check it against your revenue before you repeat it.
If you see...
One promotion taking almost the whole bar in Black Friday week
Consider...
That was your Black Friday headline. Check it earned that share in sales too, not just in impressions.
If you see...
A week where no promotion stands out
Consider...
Nothing led that week. Was that planned, or a gap in your promo calendar?
Before you run it
You need product promotion IDs in your account. If you didn’t run promotions last season, the chart will be empty. That’s expected, not an error.
The chart shows each promotion’s share of impressions, not of revenue. Which promotion sold the most is a separate check.
If you ran one promotion all season, you’ll see a simple single-colour chart. The sample above is a complex account; yours might look simpler.
Changes in the mix can come from the market or from your own promotions. The report shows what happened; the why is yours to judge.

 Works with ChatGPT, Claude, Gemini, Google Antigravity. Your export holds weekly impressions per promotion, not customer-level data. Use a paid plan of your AI tool.