PMax
Brand
Traffic Analyzer
View a timeline of brand traffic in your
Performance Max campaigns

This script
enables you to:
select your brand term – or multiple terms if needed
customize the date grouping and lookback window
specify the campaigns or campaign
types for analysis
Unlock your
Search Term Insights
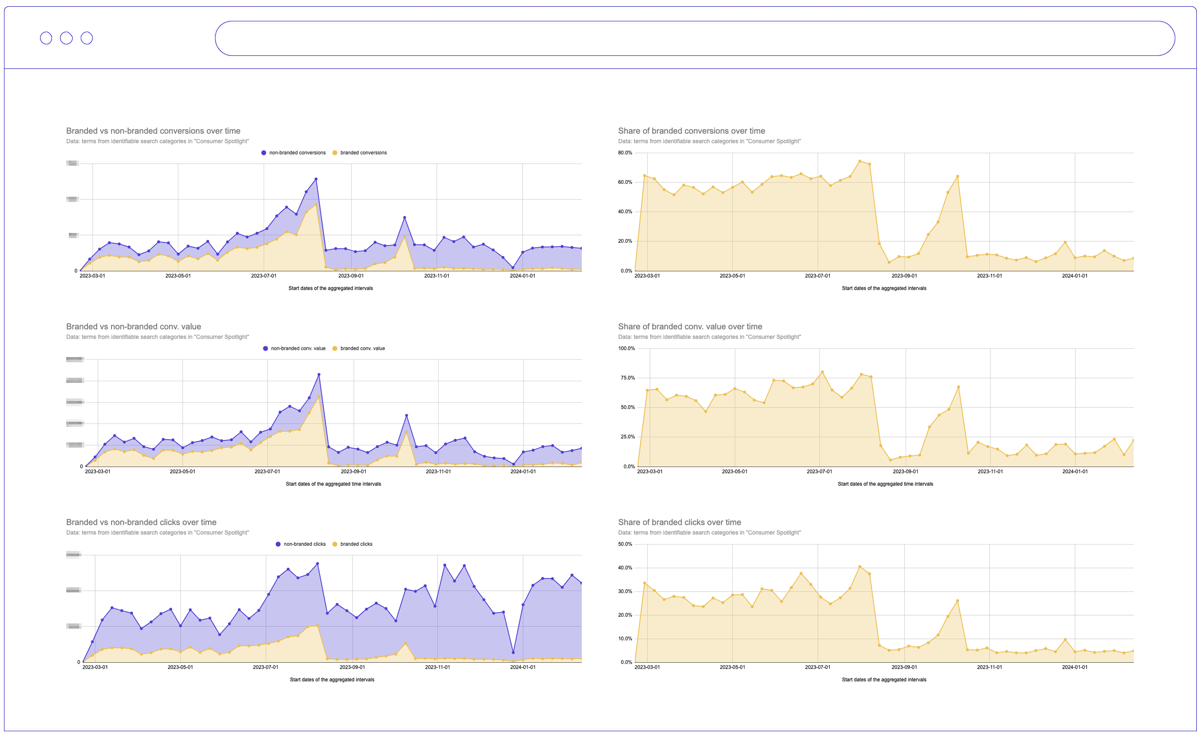
Regardless of how you manage your brand traffic in Google Ads, keeping a close eye on it is essential. This script visualizes the volume and share of brand vs non-brand traffic in your Performance Max campaigns over time.
The script taps into the new Consumer Spotlight report for search term insights. It creates date groups and strings them together to display the development of brand, non-brand, and uncategorized search terms.

All brand metrics
at a glance

While brand terms for PMax are available in the Ads interface, there is no simple way to see the big picture – and it’s even harder to learn how this picture is changing over time. We’ve solved that.
Other scripts offer brand/non-brand snapshots, but with a timeline you have increased diagnostic power. What is the effect of changes to budget or ROAS target on brand traffic? What is the impact of adding or removing assets?
Tip: Schedule this script to run daily for consistent monitoring.

Understand the share
of brand traffic

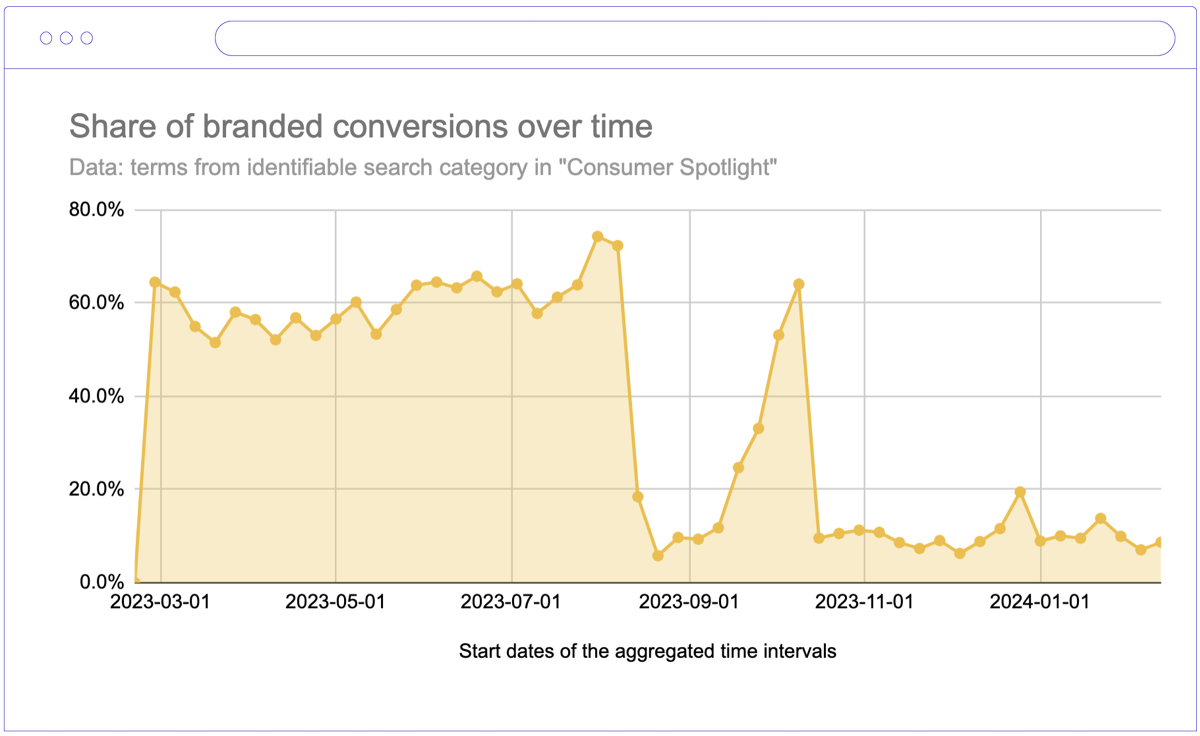
This script not only reports the volume of brand and non-brand metrics – it also calculates the percentage share of branded traffic. This is helpful because volume fluctuates, which makes eyeballing the brand share
difficult and imprecise.
Example: The image shows a big drop in brand traffic after removing assets from PMax, followed by a spike when Google automatically added new assets, and then another drop after those were deleted.
Get the script and start optimizing
Just leave your email below and unlock the script.
We take your privacy seriously. Read our privacy policy.
Get your script code below:
The code was successfully copied to your Clipboard.