Subscribe to join thousands of other ecommerce experts
The smec platform offers many actionable insights like channel-specific spend distribution, brand traffic, and real-time price competitiveness that can be hard to find or easily make in Google’s Standard reporting. While Google Ads has moved toward a more automated "black box" environment, the smec platform serves as a transparency layer that allows a PPC Manager to see exactly how their budget is allocated across the Performance Max (PMax) network and which specific business drivers are influencing results.
Table of Contents
Campaign Insights: Uncovering the Performance Max Channel Split
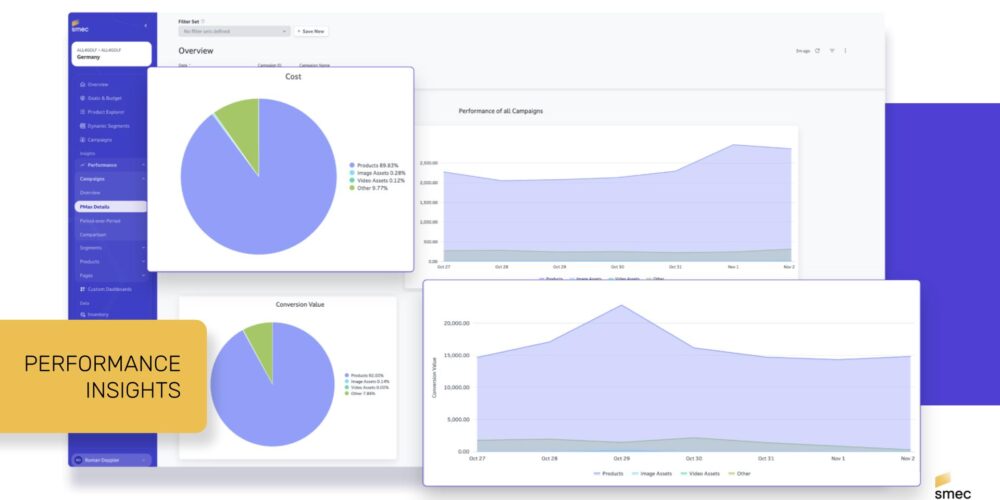
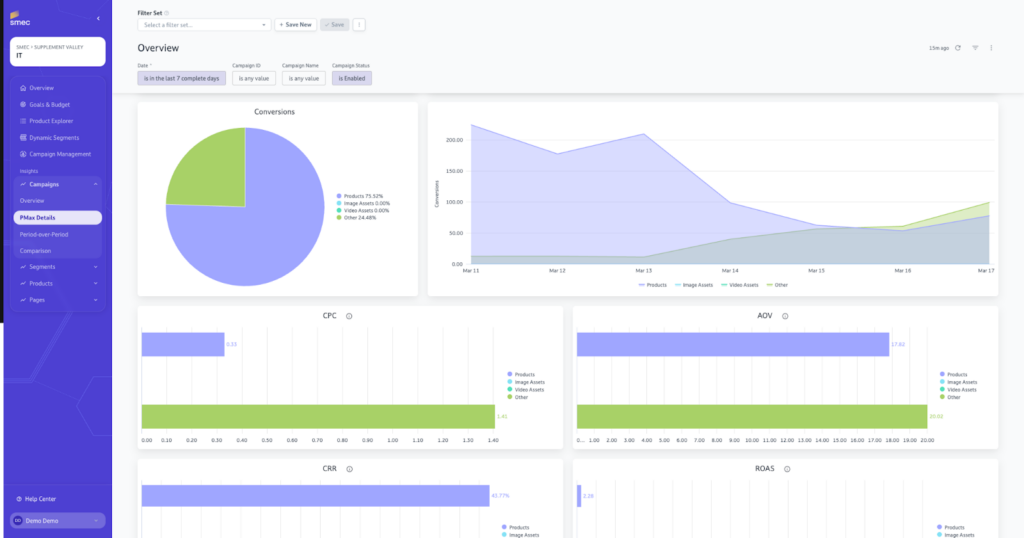
Campaign Insights within the smec platform provide a comprehensive dashboard that uncovers the exact budget distribution across Shopping, Video, Search, and Display within PMax campaigns. Google often aggregates these metrics, making it difficult to justify spend on non-shopping channels. smec provides the clarity needed to audit these placements and ensure budget is not being wasted on low-intent display traffic.
- Channel-Level Breakdown: View specific spend and conversion data for every PMax sub-channel.
- Search Term Analysis: Distinguish between brand and non-brand traffic to understand if you are reaching new customers or bidding on your own name.
- Asset and Asset Group Performance: Access detailed info on assets, including impressions, clicks, costs, and ROAS, to inform your next move.
- Placement Transparency: Identify exactly where ads appear on third-party sites to maintain brand safety.
- Comparison Reports: Effortlessly compare the performance of different campaigns to identify successful patterns.
Segment Insights: Tracking Performance Over Time
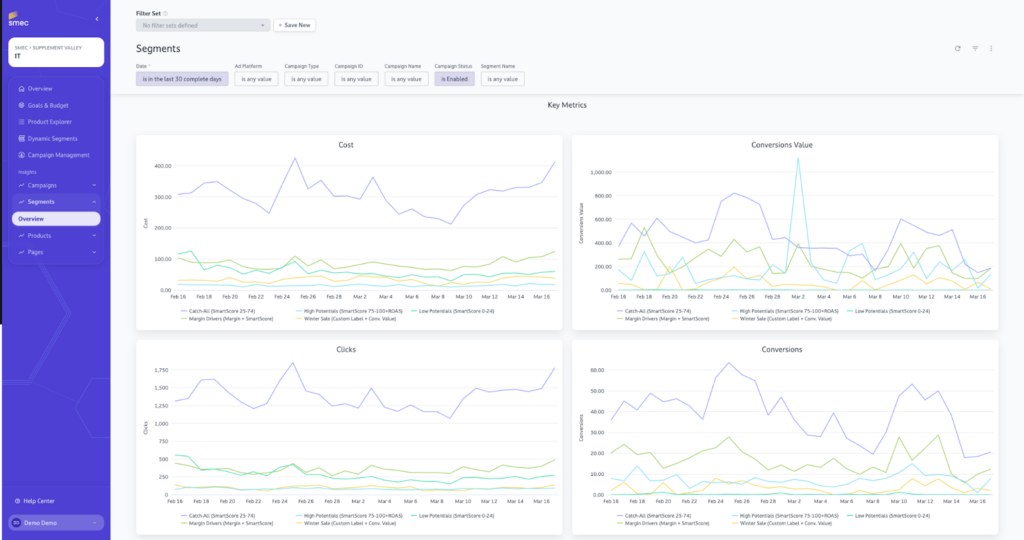
Segment Insights allow retailers to monitor the success of specific product clusters based on strategic business importance rather than just historical performance data. Standard Google reports often lack the ability to track how custom-defined groups, such as “High Margin” or “Seasonal Essentials,” evolve over time.
- Temporal Performance: Track how your strategic segments perform over time to identify seasonal trends or shifts in consumer behavior.
- KPI Comparison: Understand segment success based on a comprehensive collection of KPIs including Impressions, Clicks, Costs, and ROAS.
- Goal Alignment: Ensure that your dynamic segments remain in sync with your live business goals as products move between groups automatically.
Product Insights: Pricing and Visibility Optimization
Product Insights enable retailers to analyze individual product performance against industry benchmarks and understand the direct correlation between price competitiveness and conversion rates. This data is essential for communicating with pricing teams to find the optimal balance between volume and profit.
- Price-to-Performance Correlation: See how being priced above or below the market impacts your conversion rates and Impression Share.
- Product Movement: Track how products shift between different campaigns based on their real-time performance and Smart Score.
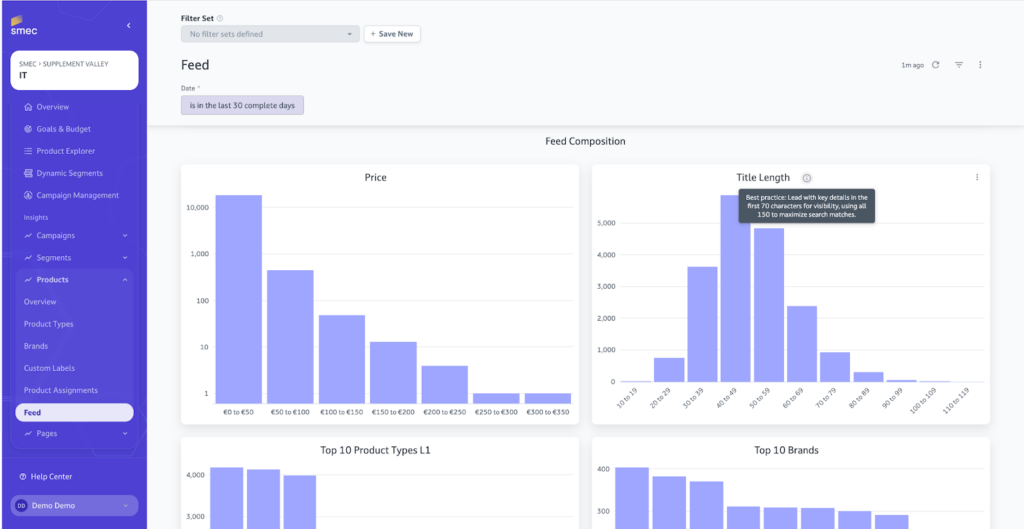
- Feed Health & Search Visibility: Identify room for improvement in your product feed, such as product title length. While Google recommends using all 150 characters for maximum search visibility, smec helps identify where your catalog falls short of this benchmark.
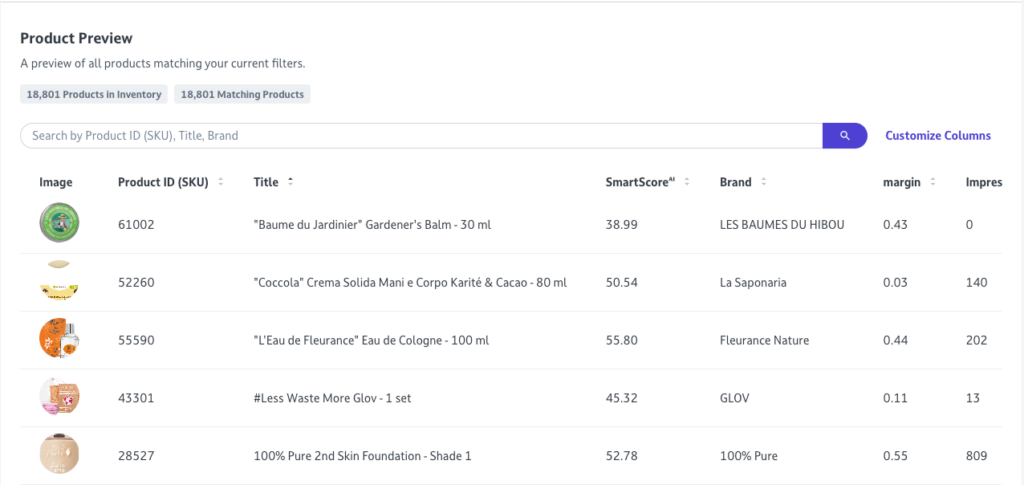
- SmartScoreAI: Use predictive AI to assess a product’s potential based on its “comparable peers,” ensuring new or long-tail inventory is not neglected.
Page Performance Insights
Page Performance Insights allow PPC Managers to bridge the gap between ad spend and the landing page experience, revealing exactly which specific URLs are driving ROI. By categorizing traffic into Product, Category, and Brand pages, you can ensure your Campaign Orchestrator is directing users to the highest-converting destinations.
- URL-Level Profitability: Gain a granular view of how specific landing pages perform, identifying “hero” products that deserve more budget and “drain” pages that are consuming spend without converting.
- Conversion Flow Analysis: Compare Click-Through Rate (CTR) against Conversion Rate (CR) at the page level to identify if a drop in performance is due to the ad itself or a friction point on the website.
Democratizing Data: Growth Without Complexity
The smec platform is designed so that you do not need to be a technical expert to find, understand, and act on your data to drive growth. While standard Google reporting often requires advanced knowledge to extract meaningful conclusions, smec structures information into intuitive Campaign, Segment, and Product views. This accessibility ensures that insights are not trapped in a spreadsheet but are immediately available to govern the AI effectively.
Stop guessing and start optimizing. Watch an interactive demo of the smec platform and its powerful insights here.
By combining this user-friendly software with the strategic guidance of specialized PPC professionals, smec ensures that every retailer can translate complex data into direct improvements in business outcomes without a steep learning curve.
FAQ
Google’s standard reports give you overall numbers but leave you blind to what’s actually driving performance. We provide the missing details:
Channel Distribution: See how your performance breaks down across Shopping, Search, Video, Display, and other channels. Understand channel distribution within PMax to control budgets and tROAS targets more precisely.
Brand vs. Non-Brand Traffic: Our Search Terms insights separate branded from non-branded queries, so you can measure true incremental performance (not brand cannibalization).
Placement Insights (Brand Safety & Efficiency): Automatically identify high-risk and spam placements wasting budget or harming your brand. Audit geographical relevance and exclude toxic websites to protect your budget and brand.
Asset & Asset Group Insights: Get reliable metrics for your texts, images, and videos. Identify which ad formats need improvement and optimize your creative setup based on data.
Landing Page Performance: See which product and category pages actually convert. Identify your best-performing pages and find underperformers to optimize.
Price Competitiveness: Understand how your pricing affects performance. See which products are priced below, at, or above market and how this impacts click-through and conversion rates.
Product & Segment Insights: Granular data at product, product group, and segment level (Dynamic Segments). Make strategic assortment decisions and identify hidden opportunities beyond standard metrics.
Cross-Platform Insights (Google & Microsoft Ads): Aggregated performance view across Google and Microsoft Ads. Analyze products, segments, and categories cross-channel to deploy budgets where they deliver the highest impact.
From channel splits to placement details to price competitiveness information — you get the transparency Google doesn’t provide.