Subscribe to join thousands of other ecommerce experts

Is it too early to talk about Christmas? Not if you want to win Q4. The gravity of Black Friday is so strong that it starts creating seasonal effects months in advance.
This raises the most important question for your business: with new data and reporting tools available that didn’t exist last year, how are you going to make this year different?
The good news? You have a brand-new tool to get started: the PMax Channel Performance Report. Here is how to make the most of it for a profitable Q4.
Table of Contents
Your Channel Reporting playbook for Peak Season 2025
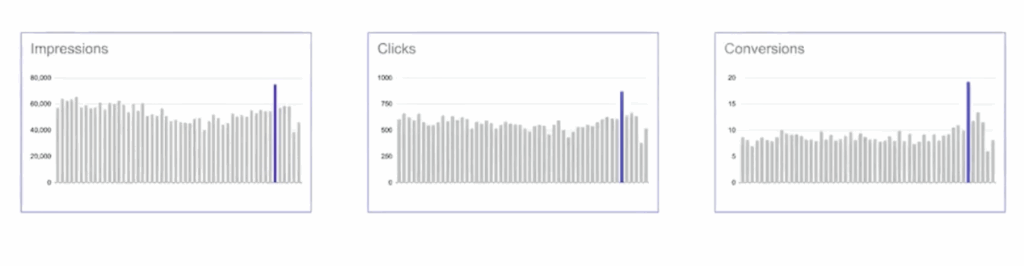
To make smarter Q4 decisions this year, you need to understand how your channel performance shifted during last year’s peaks.
With the new PMax Channel Performance report, doing so is easier than ever. However, you might still encounter a few traps along the way —
👉 Step 1: Establish your weekly baseline
First, you need to understand what your current “normal” to anticipate and better evaluate the “peaks” in your peak season performance. To do this:
- Head over to the PMax Channel Performance Report dashboard.
- Use the date range selector to pull the data for the last 14 or 30 days.
This report is your weekly baseline. It shows your standard channel mix—the blend of Shopping, Search, YouTube, and Display—before purchase intent skyrockets.
✏️ Step 2: Track your channel mix weekly
As you get closer to Black Friday, a single baseline isn’t enough. Customer behavior WILL shift week after week due to powerful seasonal effects.
Your new routine, starting in late September, is to pull the Channel Performance Report every Monday for the previous week.
You’re not just looking for growth; you’re looking for changes in the mix:
- Is the share of conversions from Shopping ads increasing? This is a strong signal that overall purchase intent is rising.
- Are interactions on your Display and YouTube remarketing ads growing? This shows your pool of high-intent shoppers is building, ready for the final push.
- Are top-of-funnel channels like YouTube getting more impressions? This points to an increase in early-stage customer research.
This weekly check-in turns your strategy from a single guess into an informed, evolving plan. So you can adapt to how customers are actually behaving in the run-up to the holidays.
📍 Step 3: Find the insights by spotting the shifts
As you compare your weekly reports to your baseline, you can answer the most important questions:
- Is my remarketing audience growing?
Look at your “ads using product data” in the Display and YouTube channels. A steady increase in spend or conversions here signals that your remarketing pool is building, ready for the final push. - Is purchase intent rising?
Check if your Shopping ads are taking a larger share of conversions week after week. This tells you customers are moving from Browse to buying. - Are my prospecting efforts working?
Look at your “ads not using product data” (asset-based) in Display and YouTube. Are they getting more traction now? This is your signal on whether your top-of-funnel creative is resonating.
A word of advive: The stock reporting chart has an issue
As you do this weekly analysis, be aware that the native report can be misleading.
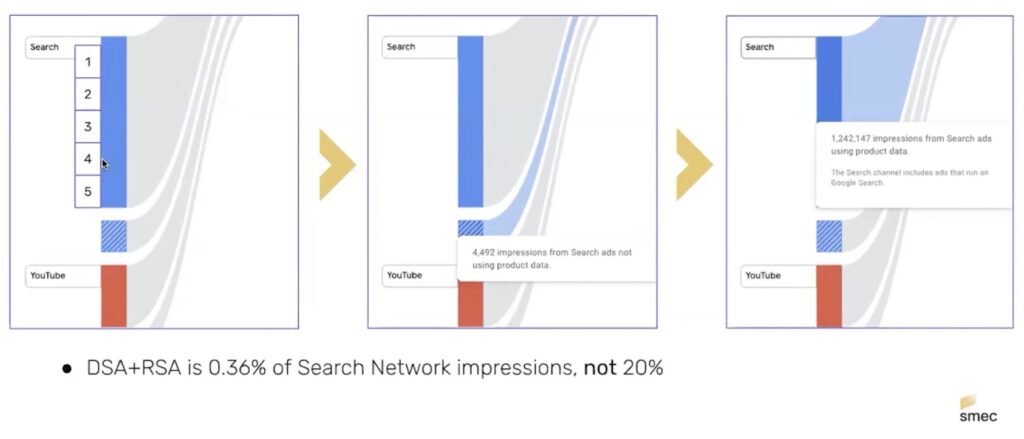
The single biggest issue is that the PMax Channel Performance Report’s main chart is visually misleading.
To show you what we mean, we pulled a chart that represents this issue perfectly:
- Asset-based Search ads (like DSA/RSA) in one campaign represented just 4,500 impressions.
- Feed-based Shopping ads running alongside them represented 1.2 million impressions.
Visually, the Search block looked like a significant portion of the activity, but the data revealed it accounted for only 0.36% of the impressions in this comparison.
Relying on the chart’s visuals alone would give you a completely inaccurate picture of what’s happening in your account.
Make faster decisions with an accurate overview
In the fast-paced lead-up to Black Friday, you don’t have time for manual data wrangling. Our free Advanced PMax Channel Report script was designed to give you a clear, trustworthy overview in minutes.
- Get an accurate weekly snapshot, fast: Turn your raw weekly data export into clear, proportional charts so you can spot trends immediately.
- Understand what you’re seeing: The script automatically applies common-sense labels (like “Shopping” and “Dynamic Remarketing”), so you’re not wasting time decoding Google’s vague terms.
- React quicker than the competition: By automating the most tedious part of your weekly check-in, you can move straight to making strategic adjustments.
Turning real-time insights into agile actions
This weekly analysis is all about making agile changes to your Peak Season strategy that directly impact your bottom line.
- If you see your prospecting ads gaining traction in early November, then your action plan could be to double down on your best-performing creative assets to attract more new customers while they are in research mode.
- If you discover that your remarketing audience is growing but not converting yet, then your action plan might include holding back on aggressive promotional messaging and prepare to increase your remarketing budget for the week of Black Friday itself.
- If you spot that PMax is suddenly cannibalizing more brand search traffic, then your action plan should be to add brand terms as negative keywords to protect your dedicated brand campaigns during this critical period.
And THIS is how you can use real-time data provided by the PMax Channel Report in combination with our FREE Advanced Report script to build a winning strategy for this year’s peak season.
source on Google →