Subscribe to join thousands of other ecommerce experts

Analyzing Google Shopping data and making the right decisions based on this is a typical PPC Manager’s challenge. Everyone wants to improve their Key Performance Indicators (KPIs), including Return on Advertising Spend (ROAS). But watch out – there are some common ROAS optimization pitfalls to be wary of. In this blog post we will discuss how to avoid them.
Quick Takeaways
- There are two common ROAS optimization pitfalls when analyzing your Google Shopping data:
- Pitfall 1: The short-term biased view. Over time, various, different products in your long tail will convert. This means ROAS per product depends on the length of the observed time window, so don’t forget the long-term!
- Pitfall 2: Cutting off the long tail If you choose not to invest in last period’s Non-Converters, they’ll miss their chance to convert now or in the future, until only your top-sellers are left. Overall ROAS might improve, but revenue will likely decrease.
- The amount of lost turnover can be dramatic – as we demonstrate via an analysis of real-world performance data.
- Instead of cutting, you should optimize bids per product, which is possible for even very large inventories using an automated bidding software such as Whoop!
Let’s start with an example. We take a short-term (14 days) view and see that we had 15,000€ of costs, 105,000€ of revenue and thus a ROAS of 7, as shown in the “TOTAL” row, below.
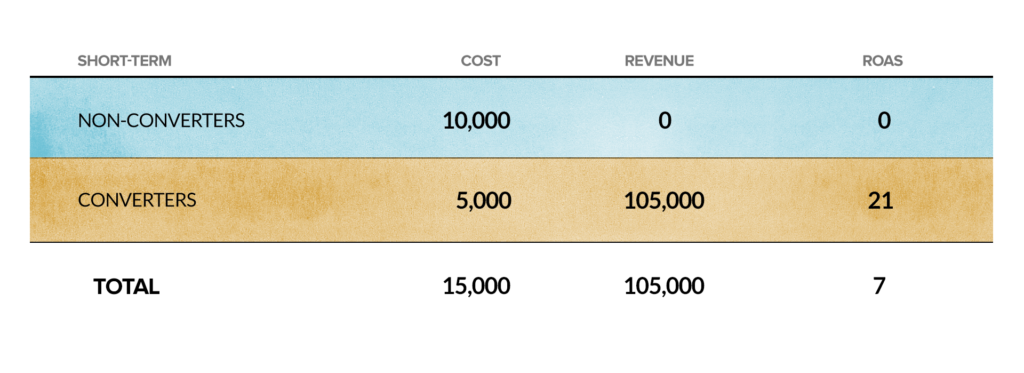
When we segment these totals into separate rows for Converters (gold) and Non-Converters (blue), we discover that the costs for Non-Converters are twice as high as the cost for Converters. In fact, it seems that by eliminating the costs of your non-converting products you could increase your ROAS to a maximum of 21 – which is a huge improvement over 7. But there are two pitfalls: you forgot about the long term and the long tail.
Table of Contents
Pitfall 1: The short-term-only biased view
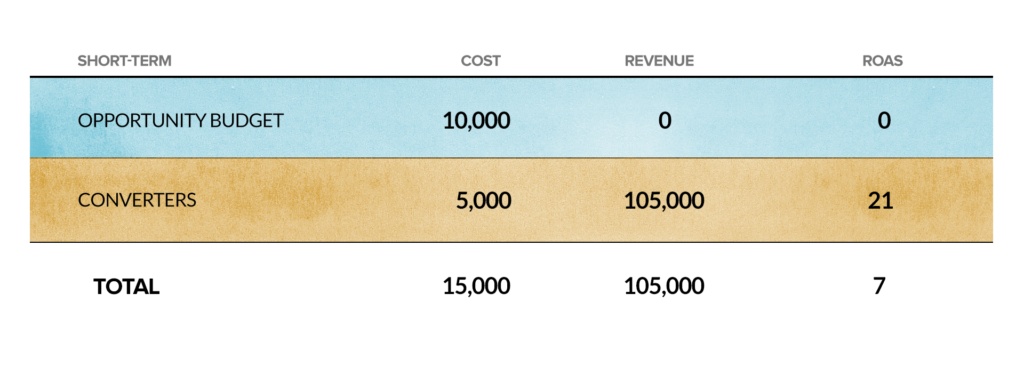
Let’s try to change our point of view and look at the Non-Converters as our “Opportunity Budget” – meaning that we invest that amount to realize unpredictable conversions in the future. In the short-term, the cost ratio of your Opportunity Budget to your Converters is still 2:1.
However when we switch to a longer-term view (6 months), something interesting happens: the ROAS in the Converters row drops to 10.5, and the cost ratio is now 1:2 in favor of the Non-Converters in your Opportunity Budget. That’s because in the long term, different products in your long tail will usually also convert. In other words, the cost ratio depends on the length of the observed time window!
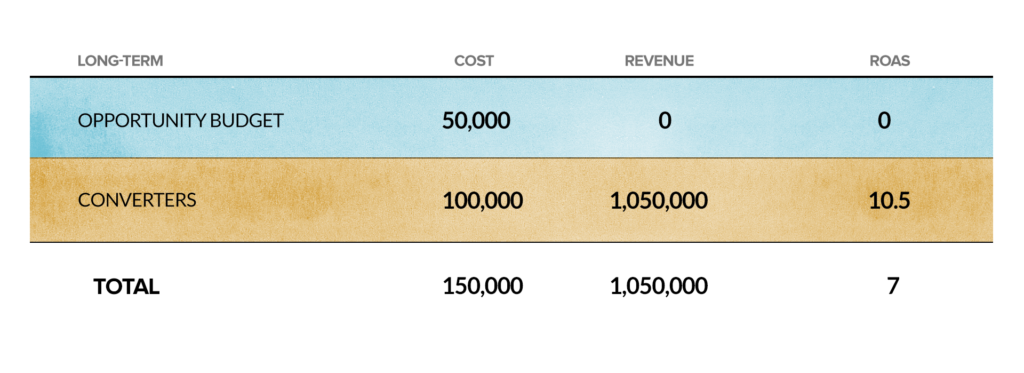
The longer the period gets, the closer the original Converters’ ROAS of 21 gets to the Total ROAS of 7. Of course, the Converters’ ROAS will only ever match the Total ROAS if you sold every item of your inventory at least once in the obtained period. Usually, that is not the case.
Pitfall 2: Cutting off the long tail
What would happen to the revenue if we cut the Opportunity Budget down to zero? Given that various products outside of your top-sellers tend to convert in each period, focusing on only one period is, of course, selection biased.
Let’s look at the process in more detail: Every period, you have Converters and Non-Converters. Some of the Converters may be top-sellers, bringing in conversions in every period, but most of your items (usually thousands of products) will belong to the long tail. Such items usually do convert, just not in every time period. This means yesterday’s non-performers can convert today or tomorrow, which is exactly why we chose the term, ‘Opportunity Budget’.
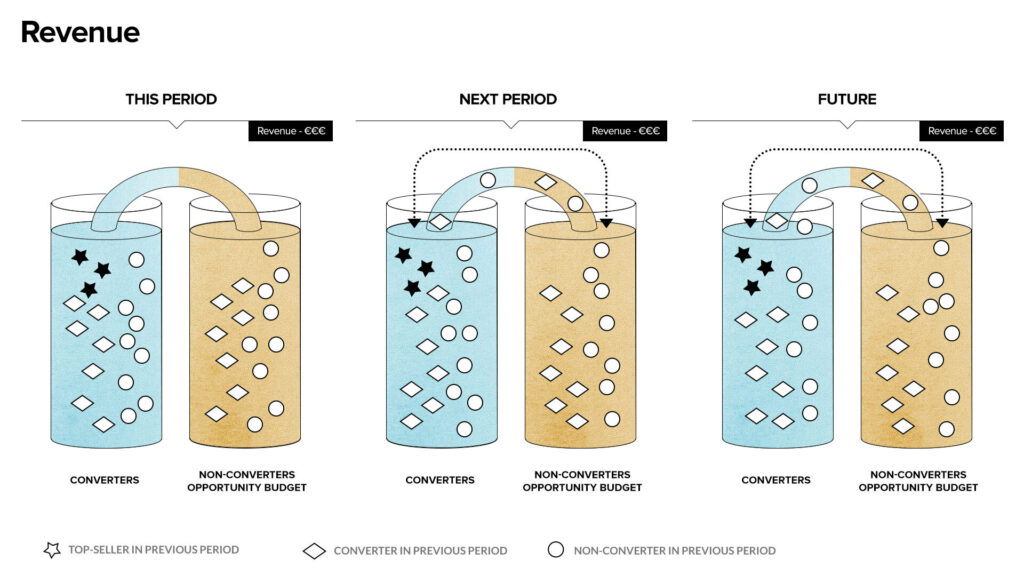
The influence of Opportunity Budget is depicted below. Over each period, items move from left to right and vice versa, as they fall in and out of the Converters group. Only top-sellers (the stars) stay in the Converters section, because they sell every period. Circles and diamonds indicate whether an item converted last period: diamonds means yes; circles, no. Usually, every period has some previous Converters which don’t convert this time, as well as some previous Non-Converters which do. This exchange is indicated by the arrows. As you can see, the converting items vary but the revenue is constant.
If you simply cut down your Opportunity Budget you eliminate the long tail, as depicted below. If you choose not to invest in last period’s Non-Converters, they won’t get a chance to convert this period, next period or anytime in the future. Thus, after a few periods, only your top-sellers will be left. Your overall ROAS could improve dramatically but your revenue will decrease in the same manner!
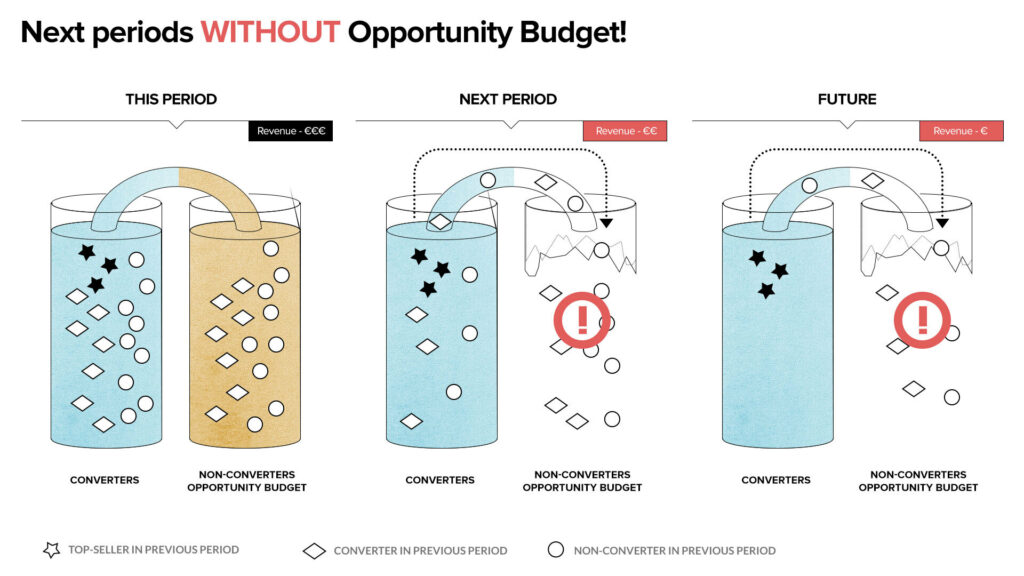
Of course, this is only true if you have products outside of your top-sellers, but that is the case for most online shops: a typical long tail covers 80% or more of the inventory while real top-sellers cover less than 1%.
To demonstrate the effect of cutting down the Opportunity Budget, we simulated this process using real-world performance data for multiple customers over a 12-month period. In the graph below, the grey line shows monthly average ROAS over all products in an example customer’s inventory. The magenta line again shows average ROAS, but with each new month, the previous months’ Non-Converters are excluded from the calculation and never re-added.
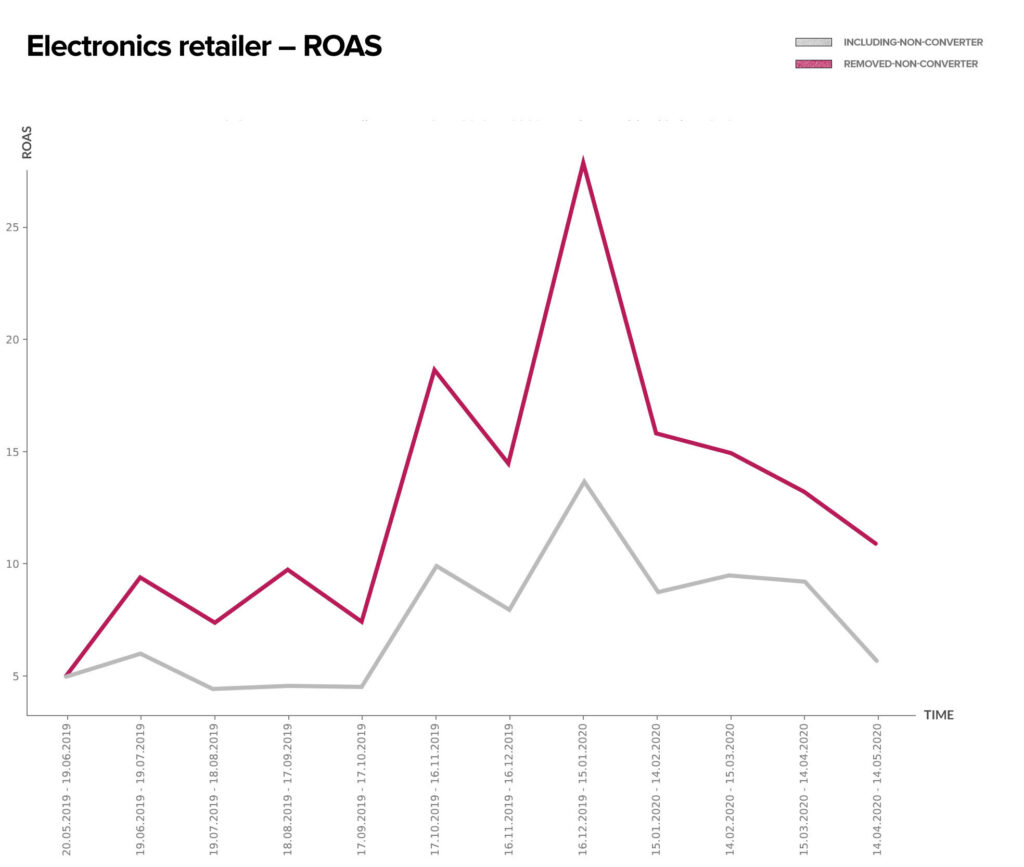
Through this process, ROAS naturally increases. But what happens to, for example, turnover? The graph below shows this data for the same customer and time period. The grey line, which represents monthly average turnover over all products, is climbing very well. On the other hand, the magenta line shows turnover calculated after removing previous Non-Converters each month, and the rate of increase is nothing like as dramatic. By taking a short-term view and spending only on Converters in order to increase ROAS, you risk harming long-term performance. In other words: if you cut down the Opportunity Budget, you cut down your turnover opportunities.
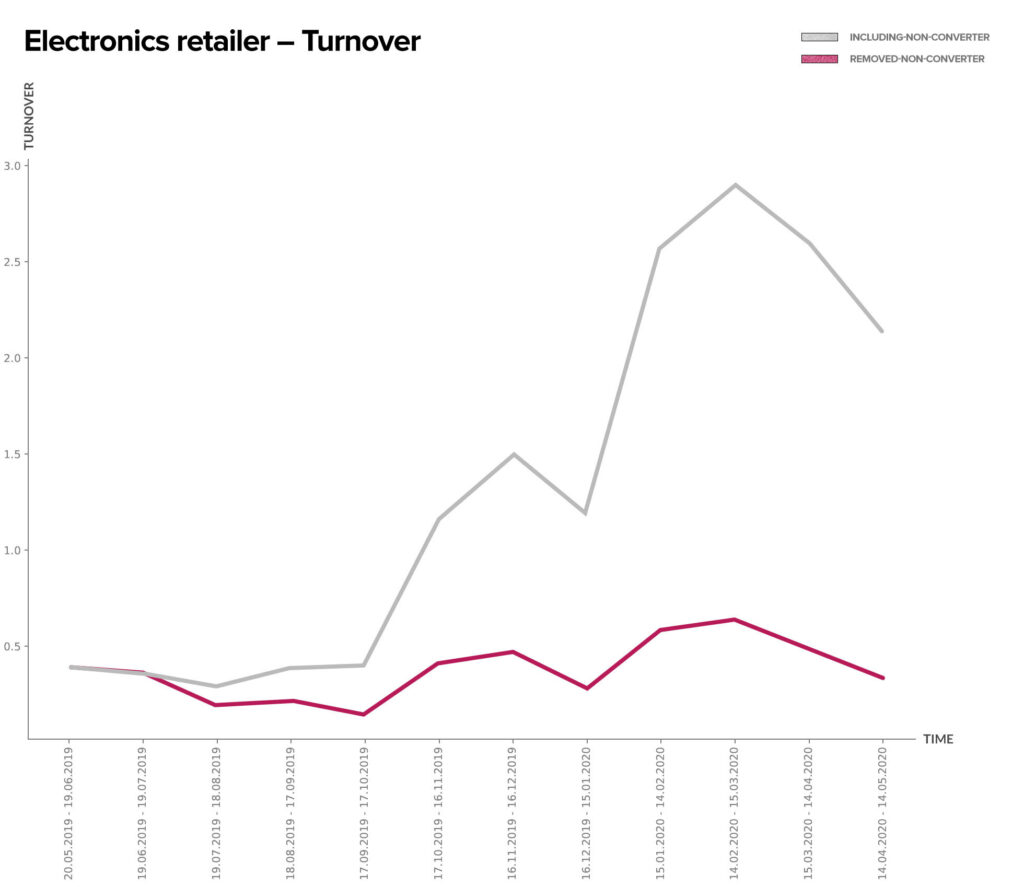
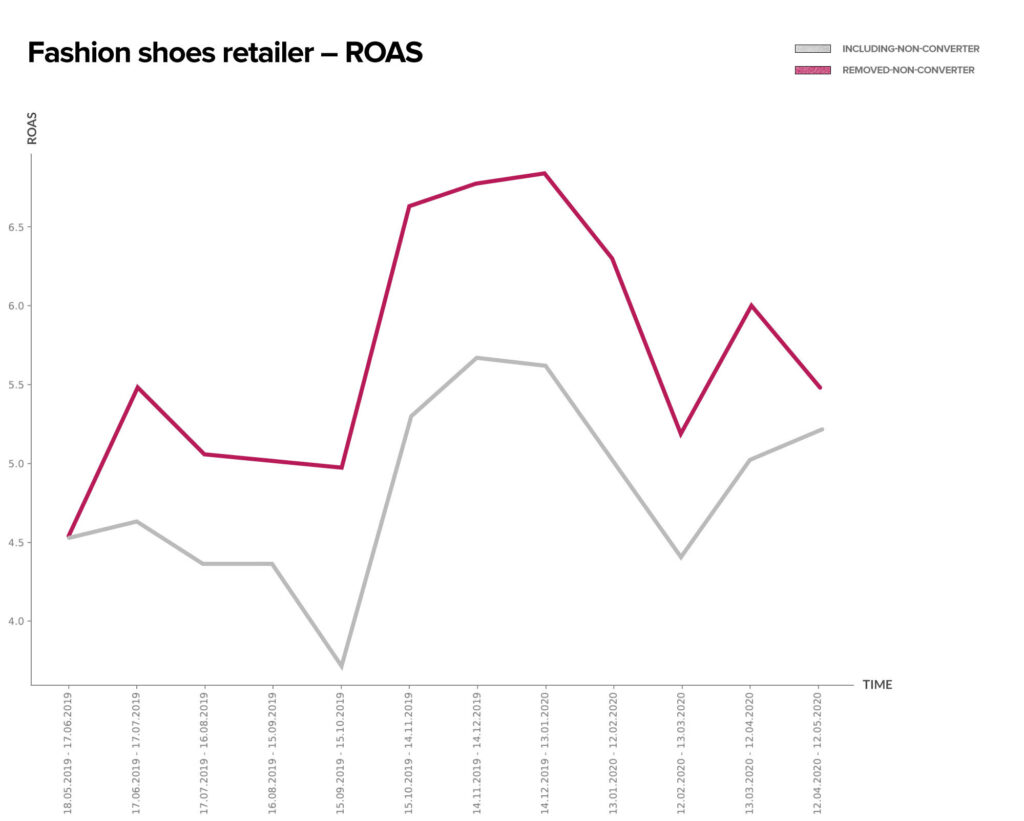
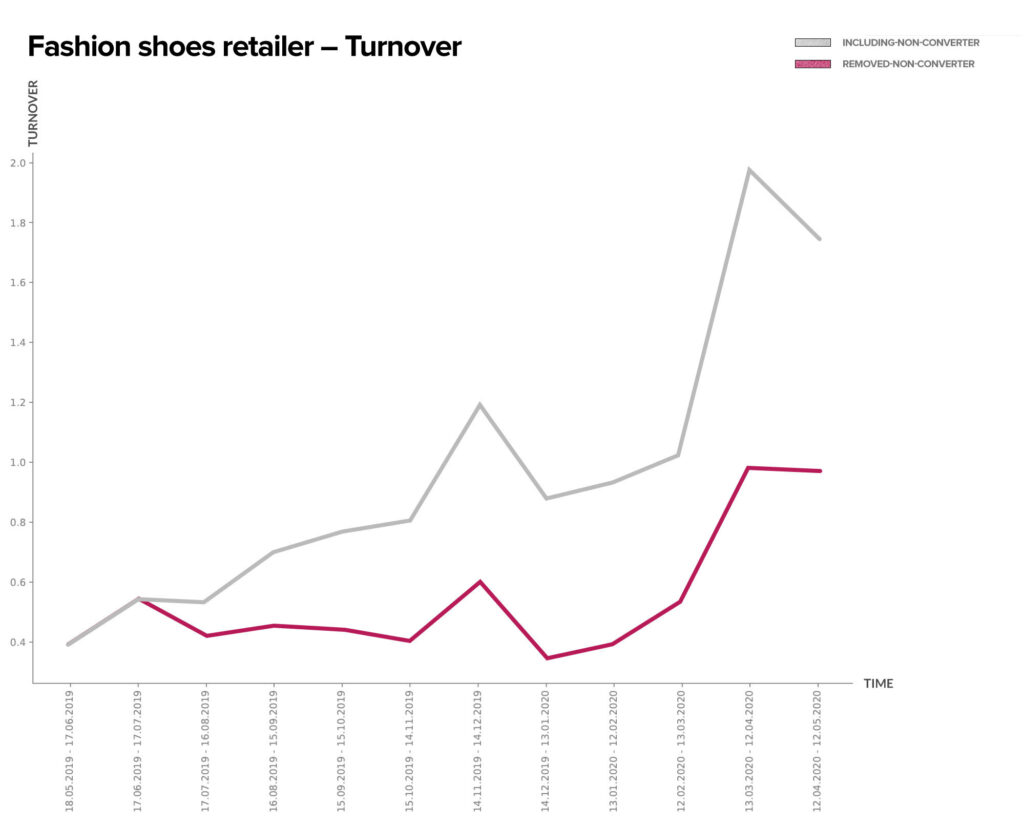
The example customer here was a large electronics retailer. However, we observed similar trends over multiple sizes of customers in various consumer verticals. So let’s examine another example customer: a fashion shoes retailer. Again, you see that ROAS is always up when Non-Converters are removed from the calculation. But as the months go on, and fewer and fewer products are able to generate revenue, the turnover falls further and further behind what would have been possible with the entire merchant feed.
Avoiding these ROAS pitfalls
As we have shown, optimizing ROAS over the whole product assortment is an important but complex task. You need to manage spending both on top-sellers, which convert in every period, and on long tail items, which convert less frequently but form the majority of many customers’ inventories and so still drive turnover.
You can do this by adjusting your bids to optimize the long tail instead of eliminating it, thereby saving money and still improving ROAS. The clue is to set bids item-wise and to use historical performance to calculate the amount you’re willing to pay for each item. Of course, the more products you have, the more this becomes a task for an automated bidding software, such as smec’s Google Ads solution, rather than a human being.
This text is an updated version of Thomas Otzasek’s blog article published on our blog in 2016.
source on Google →