Subscribe to join thousands of other ecommerce experts

When it comes to Performance Max (PMax), Google calculates impression share by adding up your Search and Shopping impressions and dividing them by the total number of Search and Shopping impressions you were eligible to receive. Importantly, display impression share isn’t part of this equation.
We’ve run a comparison between PMax and Standard Shopping and generally observed that PMax campaigns tend to have a lower impression share than Standard Shopping campaigns. Curious about why? Let’s break down the details.
Table of Contents
What is impr. share?
Impression share is the percentage of impressions that your ads receive compared to the total number of impressions that your ads could get. It is considered an important KPI for assessing the amount of headroom left in your campaign or set of campaigns. It is influenced by budget, bids (or ROAS target), feed health, and competition.
The problem with impression share for Performance Max campaigns
Since the launch of PMax, impression share was not readily reportable for PMax campaigns. This is because:
- PMax operates across multiple auction categories including Search and Shopping (where impr. share is calculated differently and reported separately)
- PMax operates across placements for which impr. share is not available at all
In the limited contexts where PMax impr. share is reportable (Auction Insights), it is not joined to performance or budget data. Therefore the influence of, for example, ad spend on impr. share is hard to know. Not only that, but Auction Insights got removed from Looker Studio’s Google Ads connector, limiting access to this data even further.
But don’t worry—Google has heard our cries. Keep reading!
The release of PMax impression share
Good news! On September 18, Google announced that Impression Share is now available for PMax campaigns.
Where to find It: Head to the Google Ads UI and open your campaigns. Google’s guide provides the steps, but here’s a heads-up: the metric is called “Search impr. share.” It covers both Search and Shopping placements combined, even though it’s labeled as “Search.” Some users find this confusing, especially since PMax also serves on other placements. But the reasoning is that both Search and Shopping impression share data come from Search Network traffic, not Display Network or Search Partners.
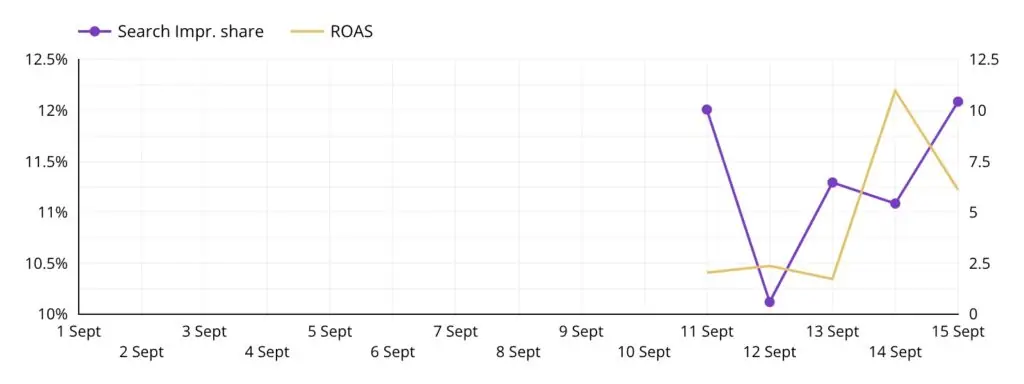
Source: smec (Smarter Ecommerce GmbH)
How is it different from Auction Insights data?
The metric discussed above, Search impr. share, is available for Shopping, Search, and now PMax campaigns. It is calculated differently for Search and Shopping camapigns, and for PMax it considers both Search and Shopping, but not Display. Importantly, Search impr. share is compatible with many other account attributes, dimensions, and metrics.
On the other hand the Auction Insights metrics Search impr. share (Auction Insights) and Shopping impr. share (Auction Insights) are a variant with limited compatibility against other account attributes / dimensions / metrics. This is because the primary purpose of these Auction Insights metrics is not look at your own impression share, but that of your competitors. It is more tightly scoped in order to protect the confidentiality of those businesses.
Comparison of PMax campaigns impr. share and Standard Shopping campaigns impr. share
Impression share is quite useful for understanding the amount of headroom left in your campaign. You can even view it across other dimensions like product type, brand, custom label, and more.
The team at smec, with head of Ecommerce Insights, Mike Ryan, had a look at the new data, and there’s something you need to know. We compared PMax impression share to that of standard Search and Shopping, pictured below. Here’s what we found:
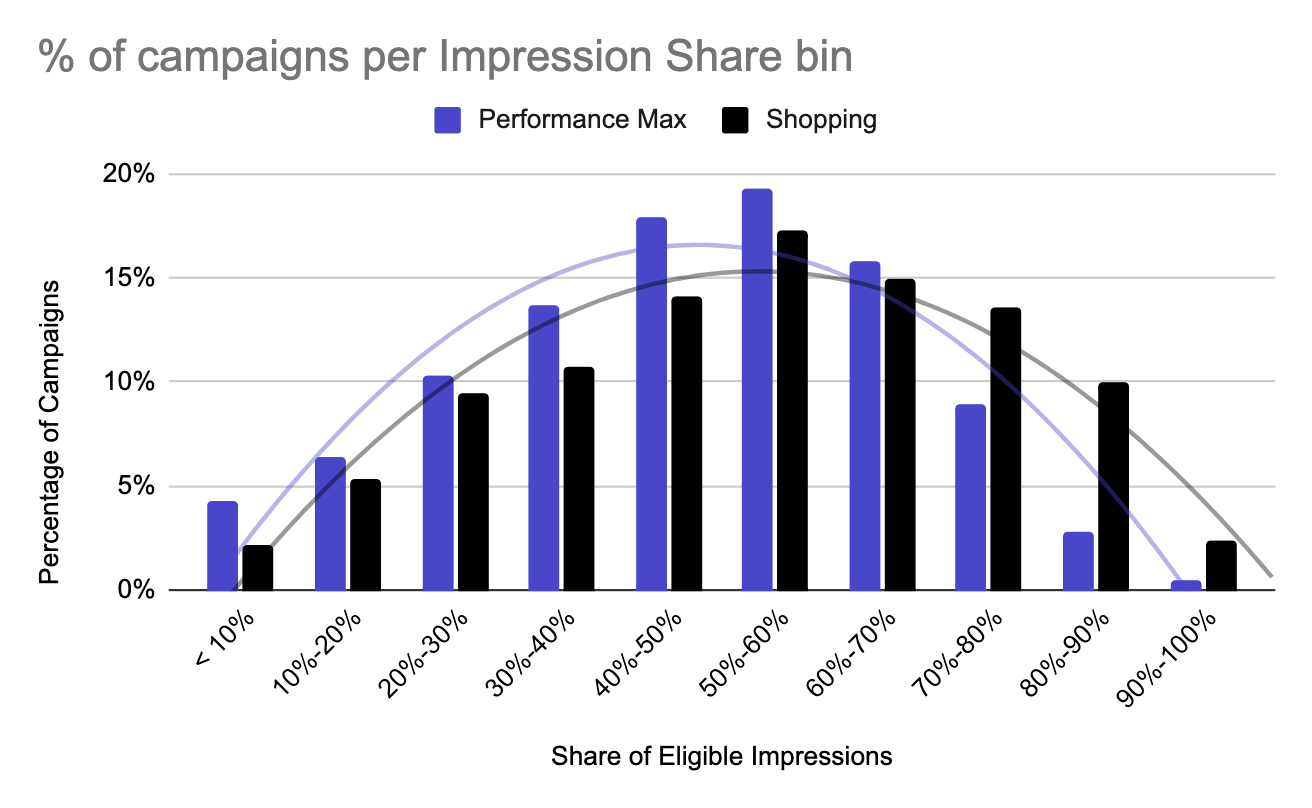
Percent of campaigns per Impression Share bin
Source: Smarter Ecommerce 2024 | n=1316 accounts
You might be tempted to think, “Aha! Shopping outperforms PMax in scaling.” But it’s not that simple.
Search impression share tends to be significantly lower than Shopping impression share. Even though PMax is roughly 90% Shopping, the inclusion of Search impressions drags down the overall impression share.
Why does this matter?
You may have a higher benchmark in mind for what a “good” impression share looks like. With PMax, you’ll want to adjust that expectation a bit lower—knock a few percentage points off the top. And keep in mind that not all impressions are created equal. Chasing a higher impression share can get expensive, and in a cross-network campaign like PMax, increasing your budget or lowering your ROAS target won’t necessarily increase your presence in Search or Shopping. It might push your ads into entirely different placements.
Interesting sidenote: Lost impression share
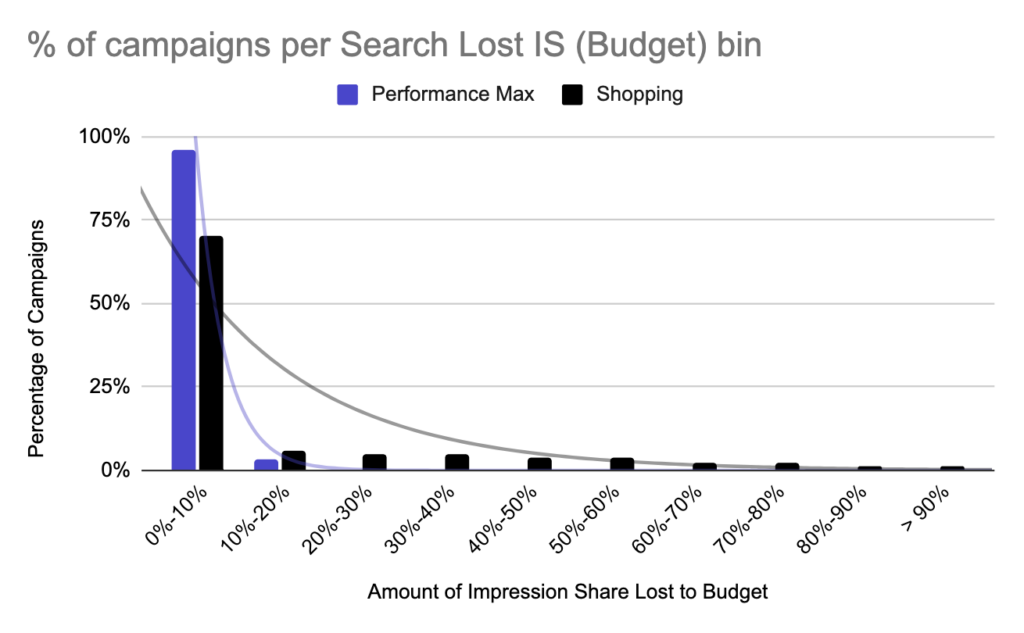
We also dug into the reasons behind lost impression share. For Shopping campaigns, lost impression share is usually split between budget and rank. But with PMax, it’s almost entirely due to rank.
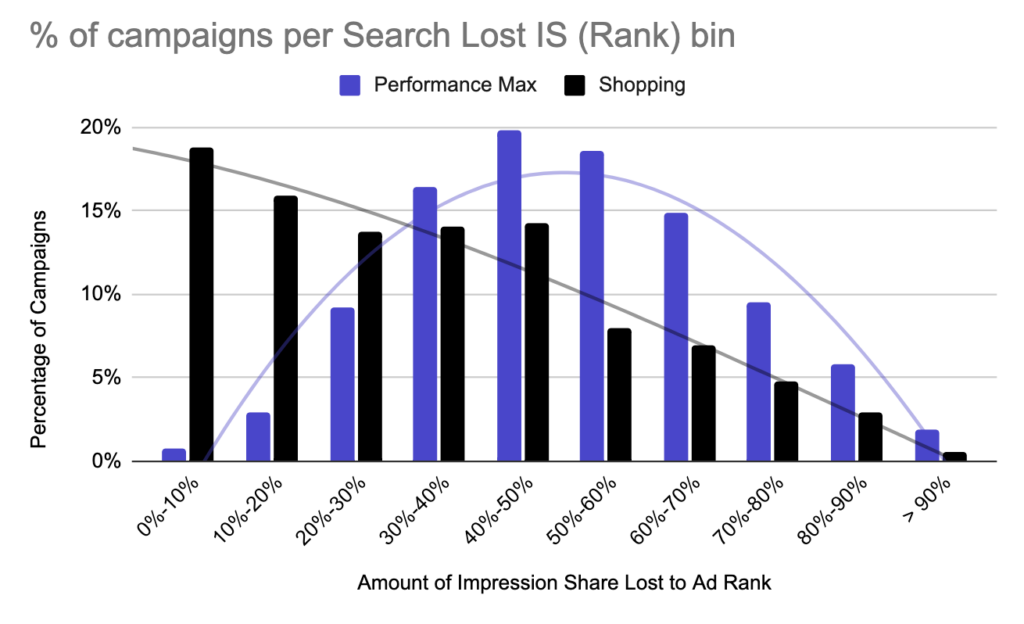
Source of data: Smarter Ecommerce GmbH
Source of data: Smarter Ecommerce GmbH
Our theory? In addition to normal rank-based losses, PMax is competing with other campaign types for the top spot. While we often talk about PMax cannibalizing other campaigns, it’s likely losing out to them in many cases as well—another reason PMax impression share tends to be lower than that of Shopping.
The bottom line
There are unique factors limiting PMax impression share, so it’s important to set realistic expectations. The current metric for PMax campaigns is a blend of Search and Shopping impressions, making it less precise. Still, it’s a valuable indicator of potential headroom in your campaigns. Keep an eye on this data, but remember that scaling with PMax involves more than just pushing for a higher impression share—it’s about finding the right balance across placements.
FAQ section
Remember: Increasing your budget or lowering your ROAS target won’t necessarily increase your presence in Search or Shopping. It might push your ads into entirely different placements, which are less profitable. That’s why you need to employ more complex strategies like multi-dimensional product segmentation and the use of tool with predictive AI to help you push also “hidden gems” in your assortment, rather than blindly pushing budget on more of the “same old”.
You need a software provider/tool, or minimum a script to monitor the distribution of Ad Spend into placement types. Then you need to observe the PMax impr. share behaviour over time compared with PMax cost distrubution over placements. As soon as your impr. share stops increasing and costs to other less profitable placement types start increasing, you’ve hit the saturation point.
No. The formula is “PMax impr. share = Search impressions + Shopping impressions divided by the total number of Search and Shopping impressions you were eligible to receive”.

