Subscribe to join thousands of other ecommerce experts
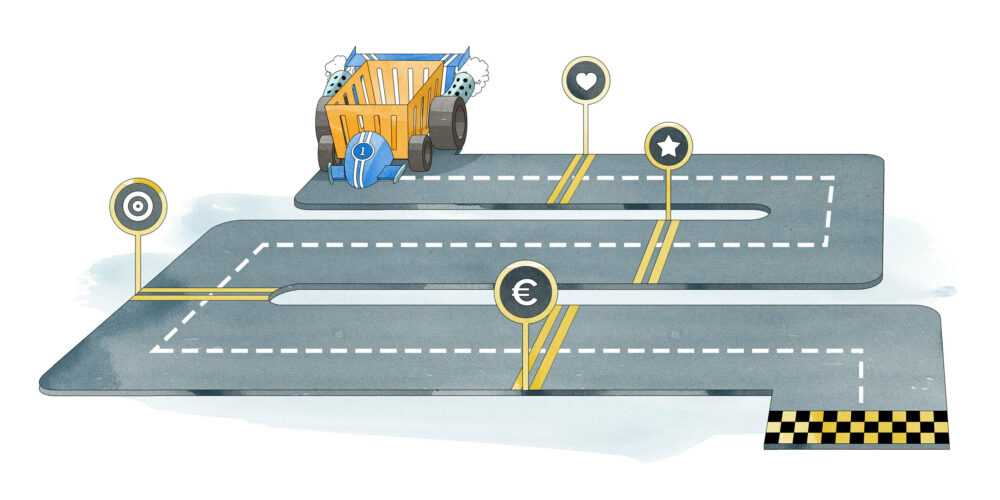
Attribution for digital media channels has become one of the most important tools for digital media buyers to assess and optimize their media spend across channels and devices. In the context of marketing, the IAB – short for the Interactive Advertising Bureau – defines attribution “as the process of identifying a set of user actions (‘events’) across screens and touch points that contribute in some manner to a desired outcome (e.g. a conversion such as a purchase), and then assigning value to each of these events.” Here you can find more details on that.
Taking a closer look on attribution, we can unfold several different approaches, methodologies or techniques, which are applied to marketing data in order to assign value to different channels and touch points. And these approaches are called attribution models.
There are simplistic models and fractional models, the latter one include rule-based models and algorithmic models. However, simplistic and rule-based models fall into the category of heuristic models whereas algorithmic models fall into the basket of evidence-based or proof-based models. In fact, there is a huge difference in the approach of the various models.
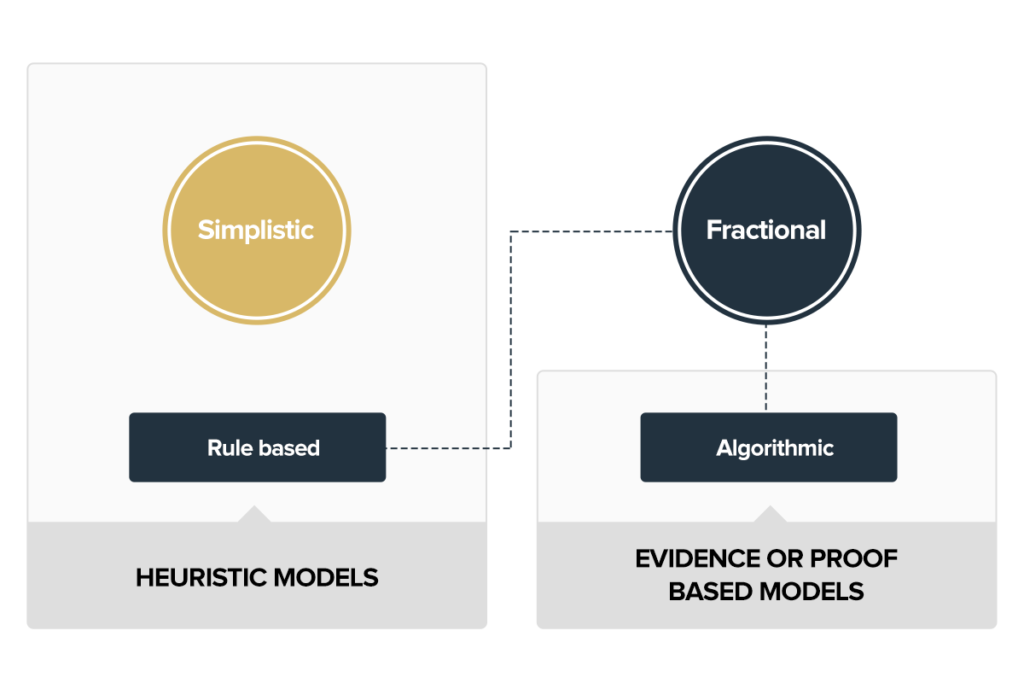
Table of Contents
Heuristic models
Heuristic models build on the foundation of rules and/or assumptions. They always accompany biases regarding which specific touch points get what amount of credit and therefore always favor a specific aspect in the sequence of touch points (e.g. the beginning of a sequence, the end of it, or distributing conversion credit evenly or predefined among the sequence).
Considering heuristic models, it’s all about what you think with regard to how different channels or devices influence performance – and therefore how much credit you will allocate to the respective touch points. As the model is not derived from using campaign- and channel-specific data but based on someone’s intuition, it’s more of a philosophy which heuristic attribution model you genuinely prefer.
Simplistic models
As the name suggests simplistic models aim to be simple. In addition, simplicity encompasses ease of measurement and interpretability. For this reason, simplistic models do not assign fractional conversion credit but only attribute the whole conversion credit to one single touch point.
For quite some time, the industry standard was last-click or last-touch attribution where all credit is assigned to the last channel interaction before the actual conversion happens. So the assumption is that the last click before a conversion is the only reason (or causal to that), thereby neglecting all other interactions that may have happened in a vast time span before. Another simplistic model is to assign all credit for a single conversion to the very first (measured) interaction (first-click- or first-touch attribution) – and, no, all other interactions won’t get any credit.
Due to its simplicity, the model itself is very biased in terms of the underlying assumption – namely that conversions are caused by single events and not a sequence of events (which is basically neglecting the customer journey). Overall, there is a high probability that simplistic models won’t capture the causal effects that increase likelihood for conversions.
Fractional: rule-based models
Unlike simplistic models, rule-based models are able to assign fractional conversion credit to different touch points along the customer journey. In general, three major types can be found here:
- Linear attribution model
- Time decay attribution model
- Position-based model
Linear attribution models distribute the conversion credit evenly among all touch points during a customer journey. Time decay models distribute conversion credit along the whole customer journey, here more recent touch points experience higher scores than the ones in the past. The position-based attribution model, also called U-shaped attribution model or bathtub model, assigns higher credit to the first and to the last touch points (e.g. 40% to the first interaction and 40% to the last) – thus, the touch points in the mid area of the customer journey share 20% of conversion credit.
This type of models takes the concept of a customer journey into account, but biases or assumptions concerning how the customer journey influences conversion likelihood still come along with it.
Evidence-based models
Evidence-based (or proof-based models, or data-driven models) build on the foundation of finding evidence to determine either a lift or a reduction of value brought in by each marketing channel or touch point. The model maps individual exposure to marketing channels and their individual contribution to the conversion value. Therefore evidence-based models are capable of reflecting reality better than any heuristic model can ever do.
Fractional: algorithmic models
There are several algorithmic models that can be used:
- Logistic regression
- Conditional probabilistic models
- Causal analysis (counterfactual framework)
- Game theoretical approaches (like Shapley value)
- Survival modelling
- Markov chains/Markov models
In this article I’d like to highlight one of them: the game theory oriented approach (Shapley value). In a follow up article, I will further demonstrate a machine learning driven approach based on Markov chains. And please note that I try to avoid any mathematical notations here but describe what’s going on with these algorithms.
Attribution modelling with Shapley value
Game theory deals with mathematical models of strategic interaction between rational decision makers, e.g. competing players in a game with set rules. One question in the field of (cooperative) game theory is how to distribute rewards realistically to all the players based on their contribution to success in a cooperative game or setting.
In 1951, Lloyd Shapley proposed the following concept called Shapley value. In the application of the concept to attribution, the actual players represent the different channels and the total set that is denoted as N players can form coalitions in order to achieve a goal, which would be a conversion here.
A coalition in game theory is a set of one or more players (the subset is denoted as S) that cooperates to achieve a goal. In the case of attribution, we consider a set of one or more cooperating channels as a coalition that works together with the aim of achieving a conversion.
The idea of the Shapley value is to then use a function v(S), also called the worth of a coalition, to assign specific values to each coalition, in alignment with their contribution to the goal. So let’s consider the following channels in order to demonstrate the concept behind the Shapley value:
- Paid search
- Display
First, we need some value that the characteristic function will assign to each participating coalition. In our example here, we go for normalized conversion likelihood. Each coalition has an observed likelihood of leading to a conversion – which I refer to as conversion likelihood (observed conversions divided by conversion opportunities). For simplicity’s sake, we normalize the conversion likelihoods so that they will sum up to 1 and the worth of the grand coalition for all channels equals the sum of the worth.
| Coalition (S) | Channels (P) | norm. Conversion Likelihood |
| 1 | Paid search | 0.18 |
| 2 | Display | 0.10 |
| 3 | 0.11 | |
| 4 | Display, Paid search | 0.19 |
| 5 | Paid search, Email | 0.12 |
| 6 | Display, Email | 0.11 |
| 7 | Paid search, Display, Email | 0.19 |
In order to calculate the worth of a coalition you sum up the conversion likelihood for all players in that coalition. Here is an example for coalition 4 (Display, Paid search).
v(S4) = Paid search (S1) + Display (S2) + Display, Paid search (S4)
v(S4) = 0.18 + 0.10 + 0.19
v(S4) = 0.47
You can now build a table for all coalitions and their value:
| Coalition (S) | Channels (P) | Worth v(S) |
| 1 | Paid search | 0.18 |
| 2 | Display | 0.10 |
| 3 | 0.11 | |
| 4 | Display, Paid search | 0.47 |
| 5 | Paid search, Email | 0.41 |
| 6 | Display, Email | 0.22 |
| 7 | Paid search, Display, Email | 1.00 |
Now, we would like to find out more about the individual or marginal contribution of channels to the conversion event. We can do this by taking the average of each channel’s marginal contribution to the conversion, respecting all possible orderings (R). This is the most intense part to wrap your head around.
The marginal contribution e.g. for the order “Paid search, Display, Email” and the channel “Paid search” is calculated as follows: As Paid search arrives first in that ordering you will have the full contribution of Paid search with v(S1) = 0.18.
For the same order and the channel “Display”, the marginal contribution is calculated by taking the worth of the coalition of Paid search & Display (S4) and subtracting the worth of the Paid search coalition (S1), which leads to 0.47 for v(S4) minus 0.18 for v(S1) = 0.29 for the marginal contribution of Display.
| Order (R) | Paid search | Display | |
| Paid search, Display, Email | v(S1) = 0.18 | v(S4) – v(S1) = 0.29 | v(S7) – v(S4) = 0.53 |
| Paid search, Email, Display | v(S1) = 0.18 | v(S7) – v(S5) = 0.59 | v(S5) – v(S1) = 0.23 |
| Display, Paid search, Email | v(S4) – v(S2) = 0.37 | v(S2) = 0.10 | v(S7) – v(S4) = 0.53 |
| Display, Email, Paid search | v(S7) – v(S6) = 0.78 | v(S2) = 0.10 | v(S6) – v(S2) = 0.12 |
| Email, Paid search, Display | v(S5) – v(S3) = 0.30 | v(S7) – v(S5) = 0.59 | v(S2) = 0.11 |
| Email, Display, Paid search | v(S7) – v(S6) = 0.78 | v(S6) – v(S3) = 0.11 | v(S2) = 0.11 |
| Average Contribution | 0.43 | 0.30 | 0.27 |
Therefore, Paid search should get 43% of conversion credit, Display 30% and Email 27%. The complexity of real world customer journeys is of course way larger and the underlying datasets are far bigger than in our example, so the computation expands pretty fast.
If you are able to dive into raw datasets (e.g. with Google Analytics 360), you should definitely consider automation here – especially when you aim for a Shapley value concept. You can also use Google Attribution for Analytics that you can find here. The data-driven model of Google Analytics also uses the concept of the Shapley value for allocating conversion credit – more information on this.
What you can do
As a matter of fact, evidence-based approaches like the Shapley value enable marketers to make data-informed – and thereby often better – decisions in a world that is getting more and more complex.
So, take your time to think about whether you are already using the best possible attribution model that reflects reality best enabling you to properly assess how different channels contribute to your online sales.
Here are some links that were used for researching on the topic:
https://towardsdatascience.com/data-driven-marketing-attribution-1a28d2e613a0
https://medium.com/data-from-the-trenches/marketing-attribution-e7fa7ae9e919
source on Google →