Subscribe to join thousands of other ecommerce experts

2020 has been a year of generation-defining disruption – and with major disruption comes both loss and opportunity. For retailers, challenges in the face of offline closures have been substantial, yet a mile-high wave of online consumption has been more than opportune for ecommerce growth. Google Shopping has been a central marketing channel for capturing that vital consumer demand, especially during Black Friday.
In recent years, Black Friday has become the simultaneous kickoff and peak of holiday shopping not only in the US, but here in Europe too. So how did this unofficial holiday look in this most unusual year? Pretty huge.
In this concise report, I’ll provide overall European benchmarks for impressions, costs, and clicks – plus specific insights for five key industries: Fashion & Accessories, Electronics, Home & Garden, Sports & Fitness, and Health & Beauty. This data is based on more than 500 Shopping accounts (501 to be exact). I will not tackle conversion or revenue here because, at time of writing, that data is not fully attributed yet.
This information is sourced from anonymized and aggregated client data, which you can view via our interactive Data Studio report at our Trends & Reports section.
Before we dive into the benchmark data, I’d like to start by looking at overall search interest related to Black Friday queries. This data is sourced from Google Trends. Let’s dig in!
Table of Contents
2020 Black Friday search interest began earlier and peaked lower
According to Google Trends data, searches including the term Black Friday were higher in volume earlier in the season in two key markets, Germany and the United Kingdom. Peak interest was also lower relative to the previous years.
While this is just one view on a complex environment, it is suggestive of a broader, less event-like holiday shopping season.
Black Friday countdown in Germany
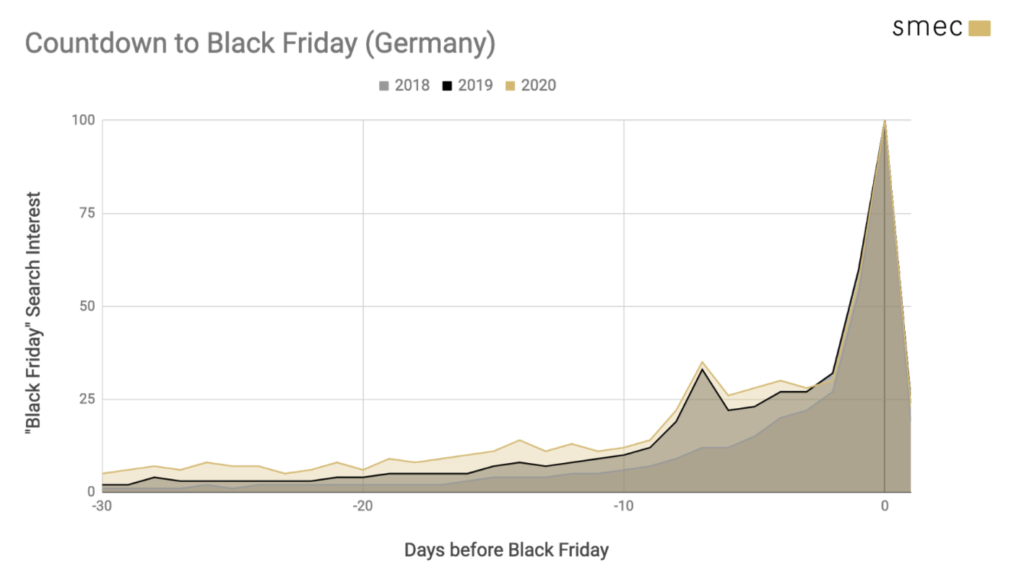
The above chart, based on Google Trends data, is used to compare how daily search interest developed in the 30 days leading up to Black Friday in 2018, 2019, and 2020. It is not intended to compare the height of the seasonal peaks: each year peaks at an indexed value of 100, but the absolute value is different for each year. Only Google knows those values.
What we can learn from this chart:
- early Black Friday search interest has increased each year relative to the peak interest
- distribution of 2020 interest was notably higher YoY from 14 to 30 days out
- in 2019 and 2020 there was a peak in interest one week out, probably correlated with deal research
- week-of volume was particularly sustained in 2020, likely due to more retailers running “Black Week” promos
Black Friday countdown in United Kingdom
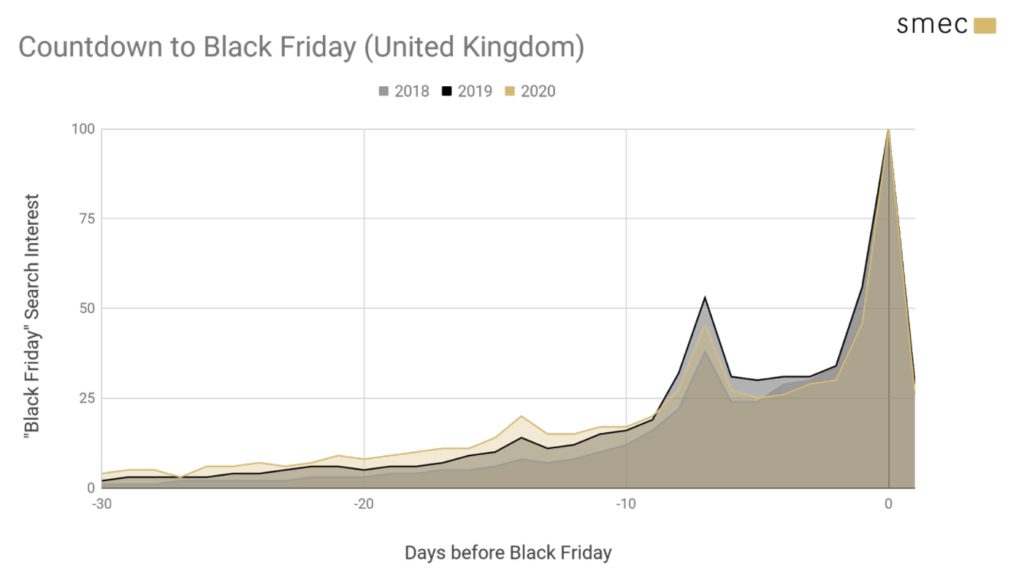
What we can learn from this chart:
- Again, distribution of interest has shifted earlier relative to the peak
- Unlike Germany, UK Black Friday week-of interest was not as significant as 2019
- A share of this interest appears to have shifted to an emerging peak two weeks out, also visible in 2019
Less Black Friday search interest in Germany and UK
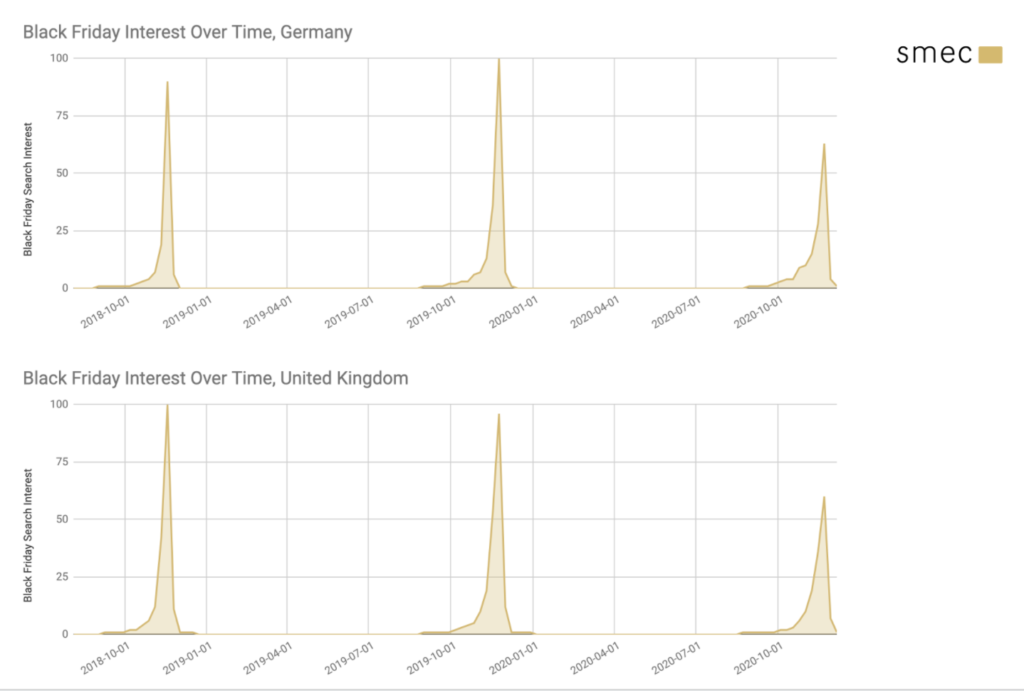
These charts are used to compare how weekly search interest peaked in 2018, 2019, and 2020 for each geographic market. According to Google’s data, search interest peaked 37% lower in Germany and 37.5% lower in the UK compared to 2019.
So what does this mean? Was Black Friday a bust – or what happened?
I would point to some key behaviors and trends to explain this:
Historically Black Friday has been a massive draw for brick-and-mortar stores. From market to market, the viability of packing stores to fill carts with offline purchases ranged from reduced to impossible. This is due both to regulatory causes like max capacity enforcement as well as changing consumer behavior.
An unknown share of the above search interest is related to ROPO deal-seeking behavior that was likely diminished for Black Friday 2020. It is probable that online interest was less affected than hybrid offline-online interest.
This hypothesis is supported by narrowing in on Google Shopping search interest instead of overall Google search interest: in Germany, Shopping interest was only 19% lower, and in the United Kingdom 22% lower.
That’s the demand side. On the supply side, many merchants chose or felt compelled to run promos earlier and longer. Amazon’s decision to hold Prime Day in mid-October and similar moves by big players fueled this trend. According to research by Shopify, 66% of merchants planned to run promos the week before Black Friday or earlier – up from 58% in 2019. The same study revealed that Black Friday promos were a strategy for only 70% of merchants, down from 75% last year.
I would suggest that Black Friday was not a bust for Google Shopping or online sales generally, but rather that it was part of a broader, earlier holiday volume trend. In the benchmarks to follow, we also see that impressions were up dramatically year-over, suggesting that while Black-Friday-specific queries may have suffered, overall product search volume was intact.
2020 Black Friday costs, clicks, and impressions – all industries
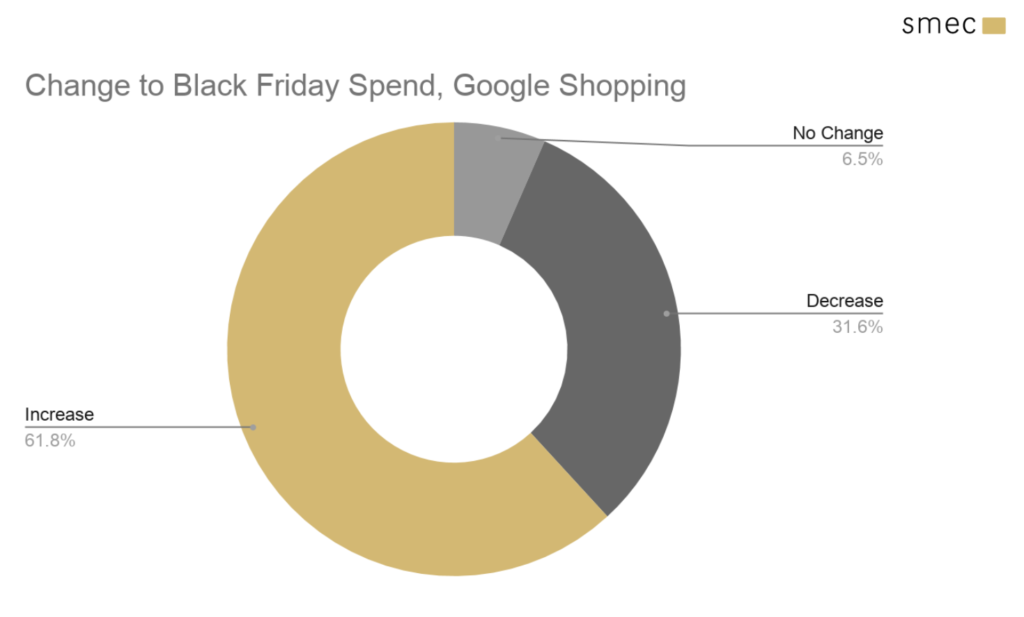
While Google search and Shopping interest were down year-over-year, looking at Google Shopping advertising stats across 20 industries tells a different story. We saw a significant increase in investment this year. On average, 62% of merchants spent more than last year – and they spent a lot more, averaging an additional 52% compared to 2019.
This increased investment is no surprise as many retailers sought to offset missing offline sales not only on Black Friday itself but from the whole year. How well that investment paid off will be the subject of a later report once the conversions are more fully attributed, but initial conversion and revenue volumes were also strong.
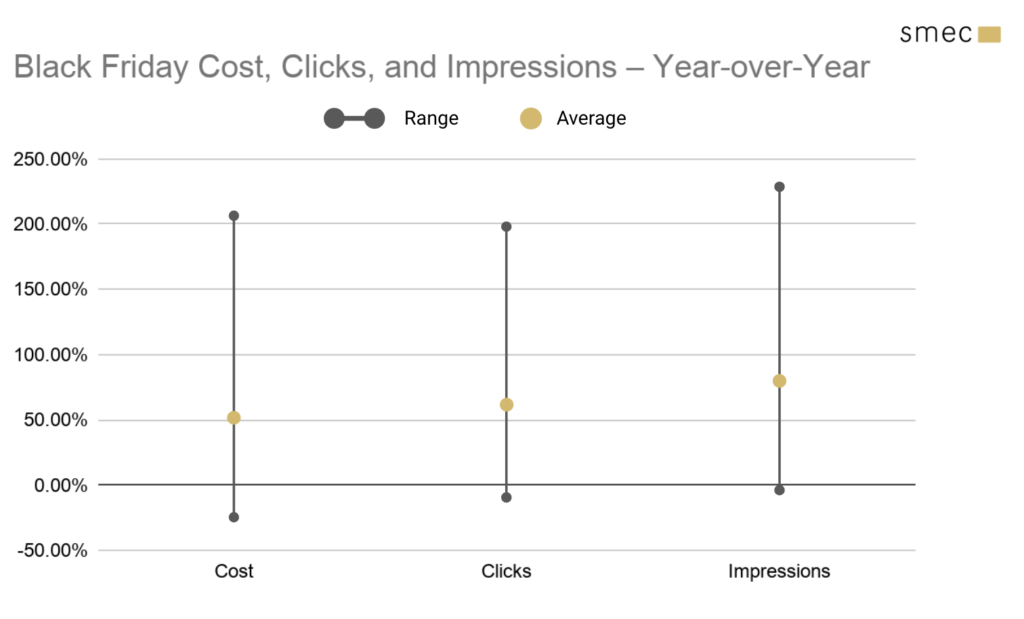
What we can report now is that Shopping impressions saw the largest upside, averaging 79% higher than in 2019. This indicates that Google could match a healthy volume of queries to products and CPCs were in place to capture that visibility. Advertisers who wanted to spend had the opportunity to.
Shopping clicks naturally held a rather similar year-over-year relation to costs but, interestingly, we saw a more narrow range overall. The lower bound was notably closer to 0, suggesting that certain segments benefitted from lower CPCs and got increased clicks without increased investment. This is in line with a general reduction in CPC that we’ve seen since the Spring lockdown in Europe.
Key industries spent more on Black Friday
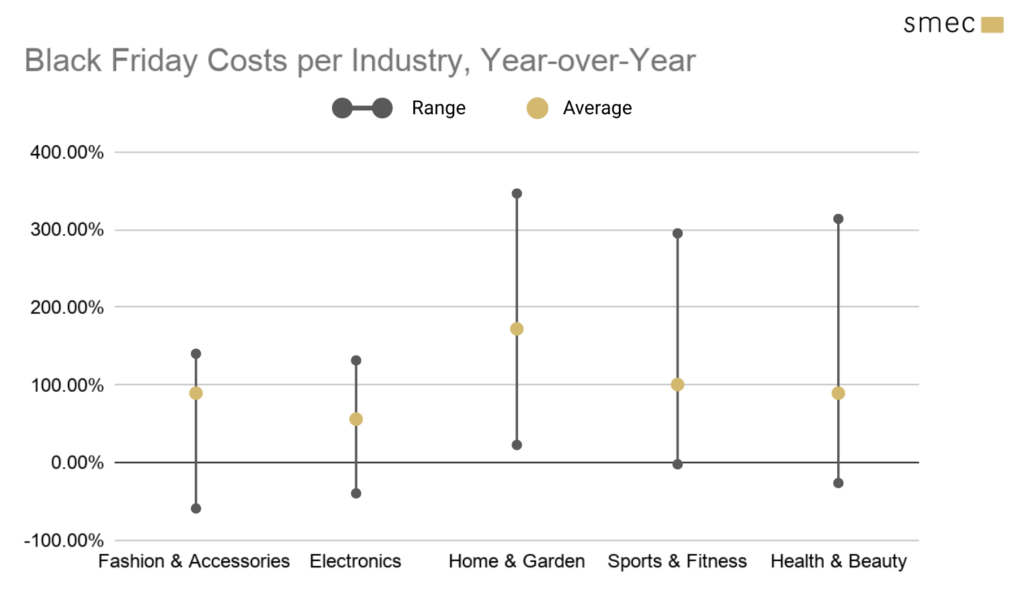
- Ranges were broader for cost than for other metrics, suggesting a diverse spectrum of budgeting and CPC strategies.
- These five key industries averaged +98% YoY costs, much higher than the +52% average seen across all industries.
- Home & Garden retailers massively upped their investment. Their growth might look more spectacular due to comparably lower historical spend volumes.
- As a “classic” Black Friday anchor industry, Electronics saw the tightest range and lowest average. These retailers were already spending huge sums, making it tougher to move the needle dramatically.
Home & Garden had a breakout year for Black Friday Shopping impressions
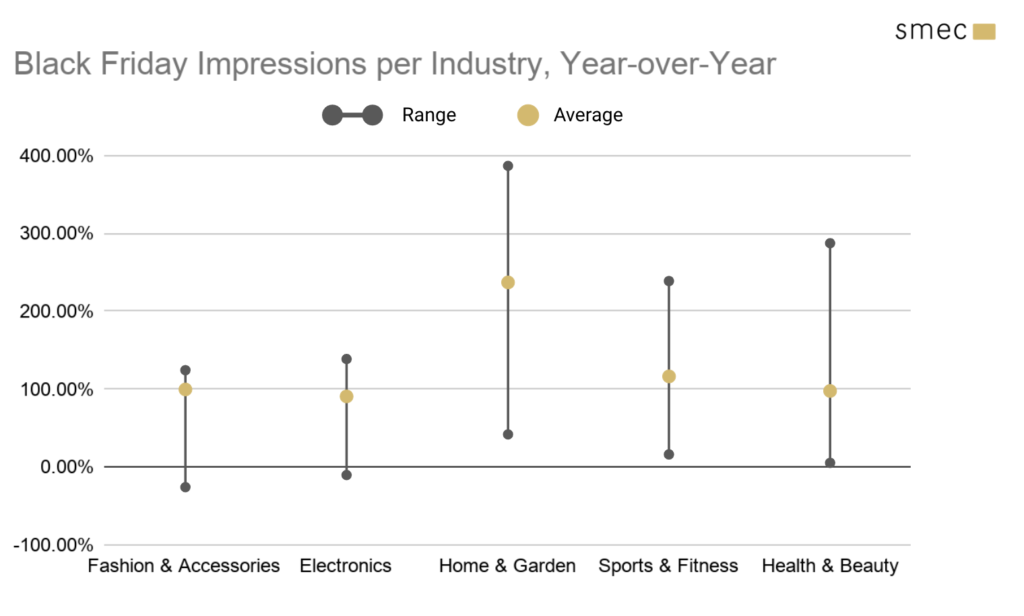
- Star Home & Garden products included space heaters and even outdoor seating – for those looking at al fresco hosting options this winter due to COVID-19.
- Fashion averaged very close to the top of their range at double last year’s volume, suggesting it was quite unusual to have flat visibility.
- Health & Beauty reached a similar average as Fashion, but with a much taller range. Some strong upward outliers pursued reach strategies via aggressive CPCs.
How clicks performed during Black Friday
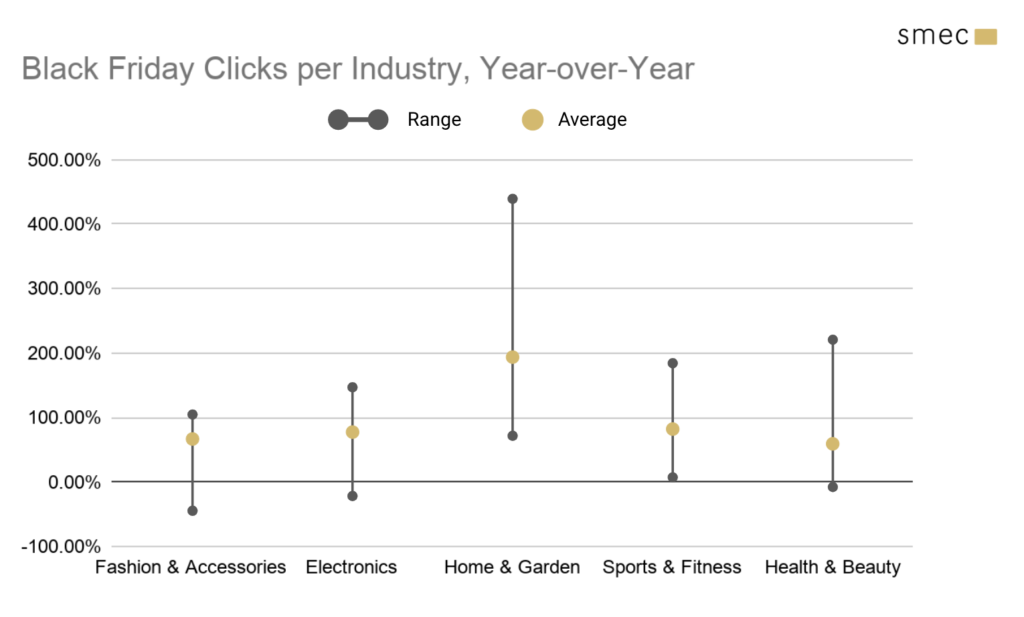
- Sport & Fitness and Health & Beauty both have dramatically lower click ranges than cost ranges, as well as averages weighted toward the lower bound, suggesting that the biggest spenders might have overextended their CPCs.
- Electronics and Fashion – Black Friday mainstays – had comparably wide ranges and similar averages. Electronics however has slightly more centered average, suggesting a more even distribution.
Hourly CPC and click development – all industries
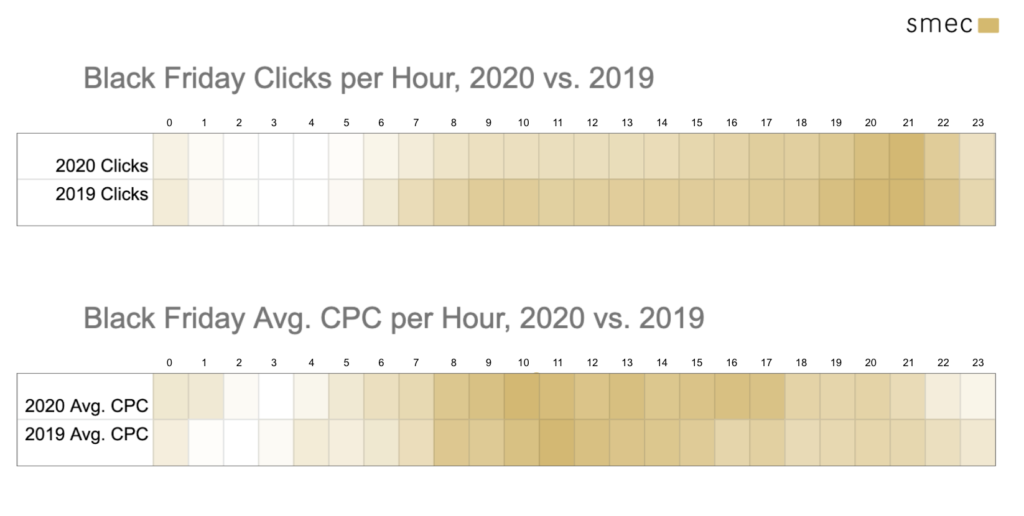
- Click volume again peaked in the late evening hours – even more concentrated around 9pm than last year. I would have expected a broader click distribution since fewer shoppers were out at stores during the day.
- While 2019 saw CPCs ramp till 11am and then gradually cool down, in 2020 we saw a faster peak at 10am that was sustained throughout the daytime hours.
Final word
Despite some indicators of cooling consumer demand and merchant-side shifts in promotional strategies, Black Friday 2020 was as key as ever for brands and retaliers. This was visible in Google Shopping where a majority of advertisers increased ad spend year-over-year – often dramatically. In key industries, this trend was even more clear.
Additional analysis is required to formulate a bigger picture and answer certain open questions: how did advertisers on the Shopping channel fare more broadly during Q4? How did Cyber Monday, Single’s Day, the rescheduled Prime Day, and other key dates develop? When more fully attributed, what story will conversions, conversion value, and conversion rate tell?
I intend to answer exactly these questions early in 2021 in a comprehensive Q4 2020 retrospective. Meanwhile, you can read my Q3 2020 retrospective for more Google Shopping insights.
source on Google →