Subscribe to join thousands of other ecommerce experts

2020’s coronavirus pandemic has been assessed as potentially the largest global crisis since World War Two – a massive challenge to health, policy, commerce, and culture. Knowing all that, I still have the nerve to ask an arguably insignificant question: what about Google Shopping?
Because for those of us to whom Shopping matters, it matters a lot! And it’s been a hell of a year.
With that out of the way, let’s get down to business. I will answer the following three questions:
- What happened in Google Shopping during lockdown?
- What happened in Google Shopping during the aftermath?
- What might happen in Google Shopping during the 2020 holiday season?
I am not a virologist, not an economist, not a politician, not a sociologist: I am an expert in online retail with access to data from hundreds of Shopping accounts across Europe.
Let’s go!
Table of Contents
The story so far: H1 2020 benchmarks for Google Shopping
At an aggregate level (all geographies, industries, and categories), the Shopping channel in Europe exhibited an average 6.5% YoY uplift in clicks at -5.5% average CPC in the months prior to lockdown. This baseline indicates moderate 2020 growth on the channel with a refreshing dip in unit cost.
How this trend might have ordinarily developed will forever remain a mystery – because the channel, like the whole world around it, was massively disrupted.
The lockdown volume bubble: +101% Shopping impressions YoY
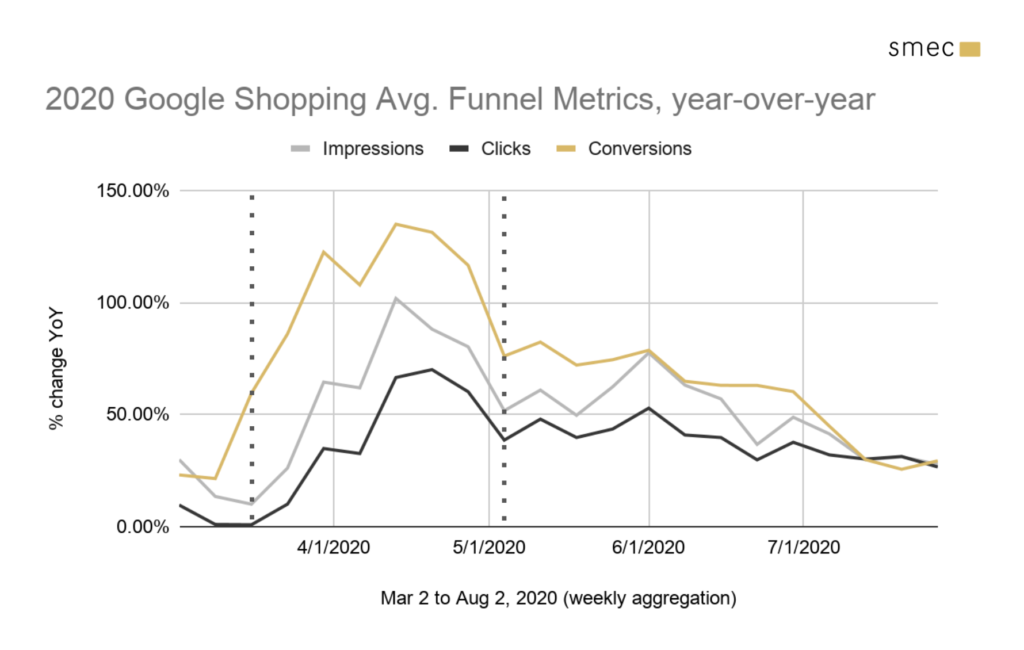
In this analysis, I reference the week of March 16 (the left-hand dotted line) as a key date for defining the start of lockdown measures in Europe. This was not uniformly the case – e.g. the UK, still part of the EU single market, locked down later (March 23). However, this week defined a sharp turning point in the crisis.
With most physical shops closed, consumers were driven in unprecedented volume to online channels. This trend was strongly reflected in the number of impressions: within a month, volume had increased 101% YoY, or double the levels seen in 2019. Click volume followed that timing closely and peaked +70% YoY.
But conversions behaved differently – much differently. This metric climbed sooner (nearly 60% in the first week) and peaked higher but also more broadly, with an epic four-week run of greater than +100% YoY conversion volume.
Why did conversions behave one way, while impressions and clicks behaved a different way? It had to do with the funnel rates.
The lockdown intent bubble: +19% Shopping conversion rates YoY
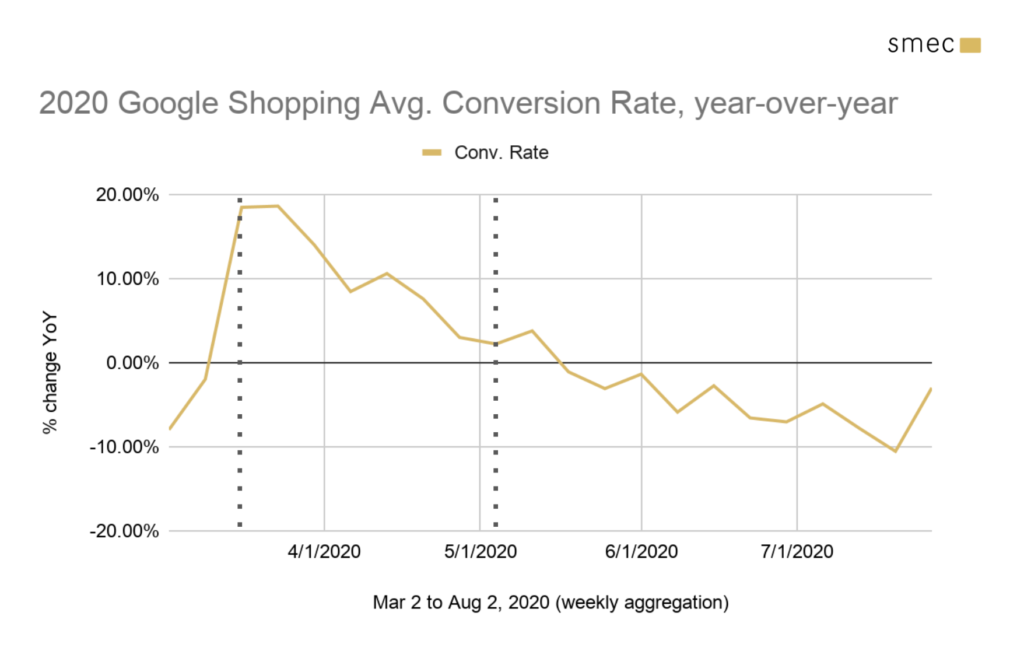
As you can see above, Google Shopping conversion rates responded immediately and forcefully to lockdown measures, well before impression volume peaked. This is indicative of the urgent and intentful shopping behavior of consumers faced with change and uncertainty.
As it became clear that lockdown wouldn’t be a simple matter of a couple weeks, impressions and clicks kept inflating. Even though conversion rates were dropping, they were still high, and this interplay of elevated volume and intent created a “perfect storm” of inflated conversions, culminating in a massive +134% YoY gain one month after lockdown began. Bear in mind, different industries and categories fared differently: this is a picture of the whole channel.
-18% CPCs: Why did clicks lose market value?
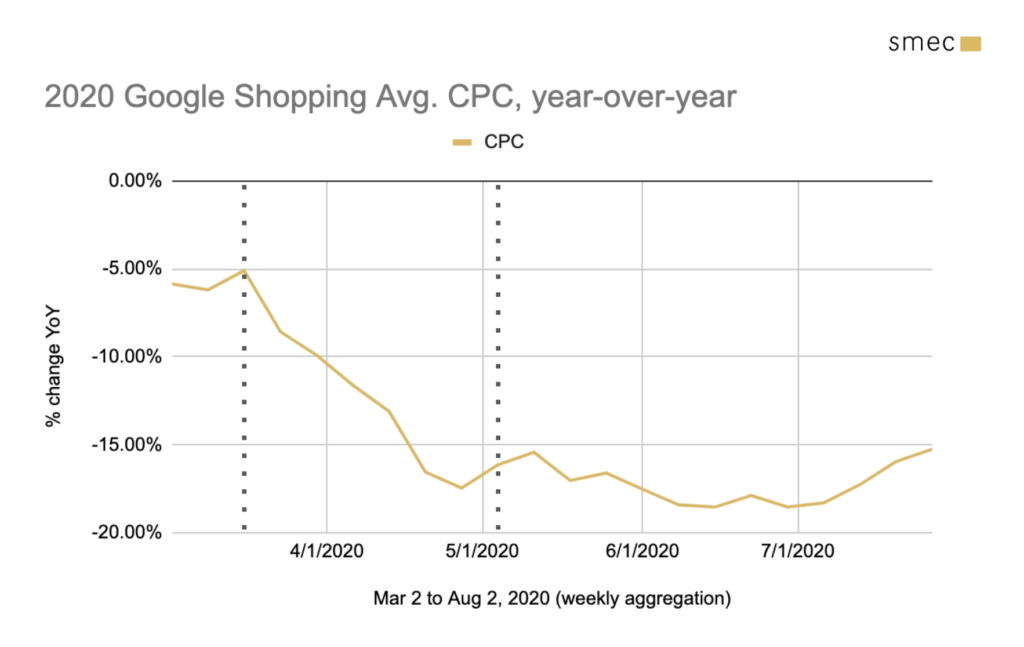
There was a fascinating inverse bubble effect visible on average CPCs in Google Shopping during this period: the metric started diving as soon as lockdown began and would later spend weeks hovering at a depressed -18% YoY.
In their Digital Marketing Report for Q2, Merkle also notes a big rise in clicks and a collapse of CPCs in the United States just like we saw here in Europe. Their explanation for the downward CPC trend is that advertisers were unwilling or unable to spend on high CPCs due to lower competition, logistical challenges, and reduced offline conversions.
Those factors are certainly interesting to look at, but fail to explain what occurred here.
First, I do not agree that advertisers were intentionally bidding down or lowering their CPCs, since a majority of advertisers have ditched manual CPC in favor of automated bidding that is based on conversion data rather than click data, typically using a ROAS or CPA target. Even assuming more conservative goals became common during lockdown, these automation systems would look at conversion rate as a primary signal for setting CPCs, meaning that during the intent bubble when conversion rates spiked, it would actually be reasonable to see CPCs get higher.
Furthermore, I would not say that competition lowered. Yes, there were some temporary dropouts from the auction (most notably Amazon) and unfortunately some business closures – but many other businesses joined Google Shopping for the first time or doubled down on their presence to compensate for lost offline sales.
In my assessment, this year-over-year drop in average CPC was due to a surplus of ad inventory, plain and simple. This surplus is clearly visible in the way impressions peaked at +101% YoY while clicks only peaked at +70%, which suggests that more auctions went without a click. CPCs have been rising for years because channel saturation has been growing faster than ad inventory, but that situation was temporarily reversed.
Aftermath: singing the month-over-month blues
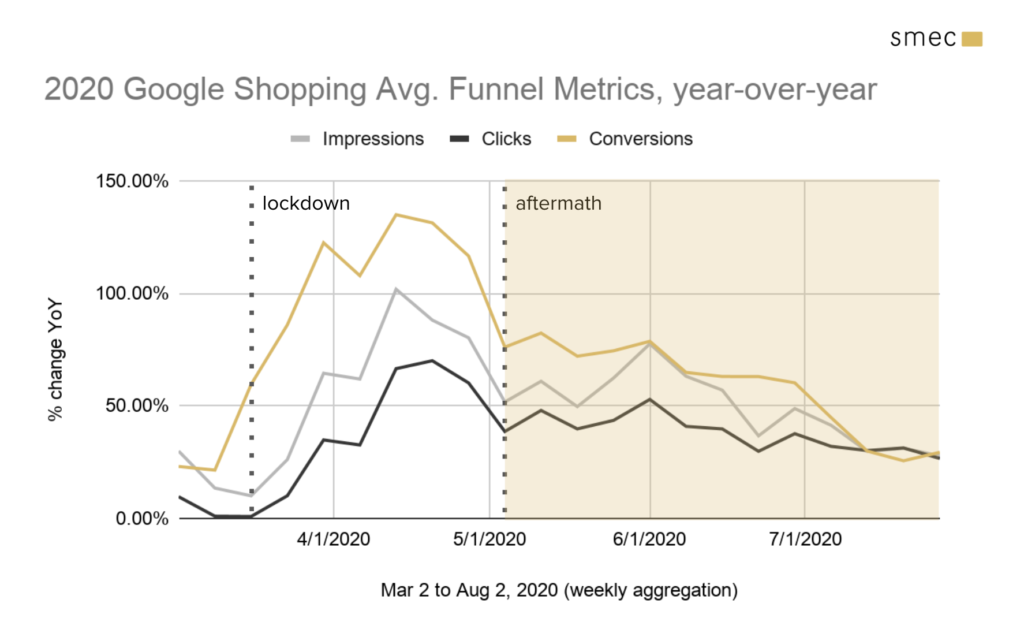
From the week of April 13, the year-over-year Shopping funnel volumes declined until the week of May 4 (the right-hand dotted line). This marks a new phase that I call the aftermath. Here, clicks reached a bumpy but nevertheless (relatively) stable plateau – a new normal about 15% above 2019 figures. However, Shopping conversion rates continued to drop until they finally reached negative year-over-year value in the week of May 18.
Why?
The conversion rate collapse was likely due to three major factors:
- consolidation of demand
- new online shoppers
- decreased discretionary spending
As a consequence of this bursting bubble, many merchants who had come to expect increased revenue from Shopping or who depend on the channel for replacement traffic for their physical stores were now disappointed. A typical outcome might include a garden shop facing flattened seasonality since shoppers had stocked up early, or a consumer electronics shop whose customers already spent on home office gear and are now skipping an upgrade on their TV – they have different spending priorities.
Especially prevalent for advertisers: what I call the month-over-month blues. That means comparing May to April and then June to May, and asking what is going wrong in the account, when in fact there were unprecedented market forces in effect.
The time series data that we rely on so heavily for understanding our performance and the effectiveness of our marketing strategies has rarely if ever been so severely disrupted in Google Shopping. Disruptions of this magnitude are arguably better known in the SEO world, where updates to Google’s algorithm can cause huge sea changes in the flow of organic traffic. Worse still, this analysis turmoil will not be short-lived: we’ll need to contend with the legacy of this data in year-over-year comparisons throughout 2021.
Q4 2020: Happily ever after?
In summary so far, many retailers and brands saw intense spikes in online purchasing volume and intent in the first two months of the COVID-19 health and economic crisis. This was followed by a period of volatile market activity with depressed conversion rates and, more recently, climbing CPCs that have often frustrated advertisers’ attempts to gain traction – leaving many to bet big on the holiday peak in Q4.
What will happen? How will it look? Nobody can know this definitively, and there are huge wildcards, but let’s have a look.
Trends for Q4:
- very different baseline performance than 2019
- higher and broader impression peak expected
- conversion rates might peak lower than normal
- Targeting will be a core challenge
- Black Friday is especially unpredictable :-/
- You will walk away with bags of revenue, but profit?
Before we begin…
Before talking about Holiday 2020, let’s quickly recap Holiday 2019:
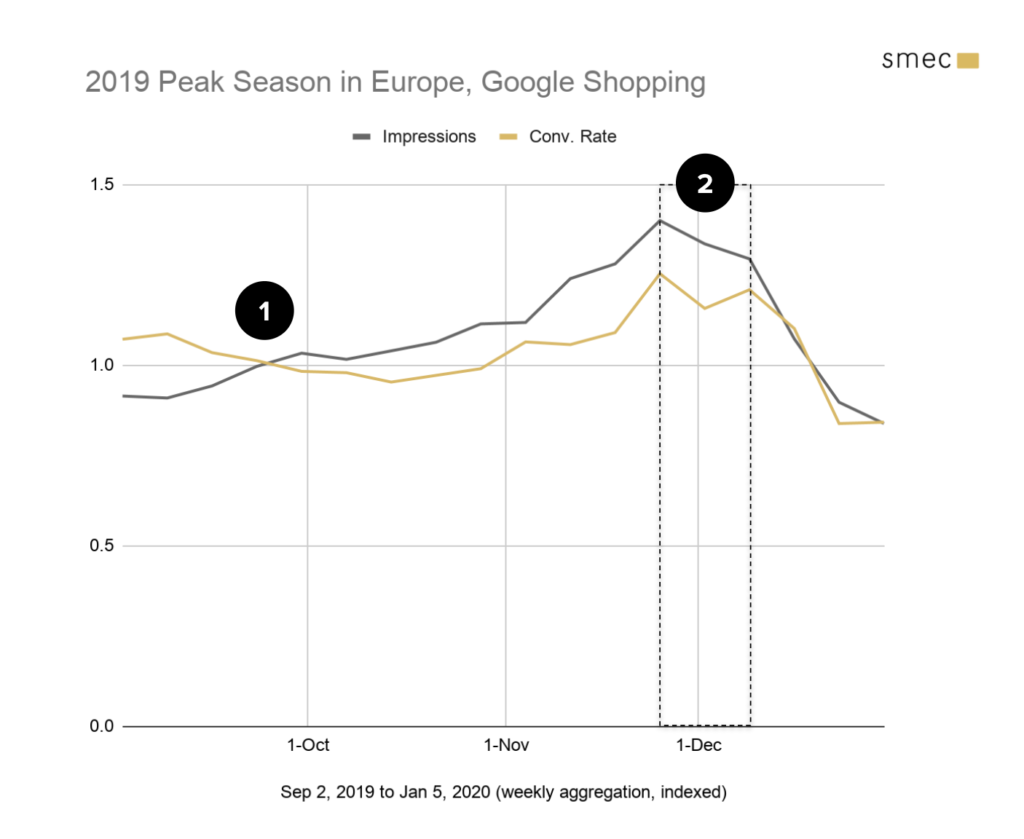
Here I chose to graph Google Shopping impressions and conversion rates to give a sense of how volume and intent worked together last year. The data is indexed so that the two-month average of each metric for September and October is equal to 1.
I’ve highlighted two core trends:
- As impression volume steadily ramped in September and October, conversion rates lulled. To me this is highly suggestive of increased browsing and research – finding the perfect gifts, waiting for the best deals. In November the volume growth sharpened until…
- All that latent demand erupts in the last week of November, Black Friday week. There is another peak in conversion rate in the second week of December, as online shoppers rush to place their orders on time. From the third week of December, volume and intent are gone.
In a nutshell, 2019 exhibited a classic, tidy, picture-perfect holiday peak.
Google Shopping predictions for Holiday Season 2020
Like many, I have high hopes for Q4. I think it will be absolutely huge for ecommerce – but also bumpy. My top concern is that while conversion volume should ultimately be much higher than 2019, the ratio to impressions and clicks will likely be lower. This means that advertisers will need to pan for gold.
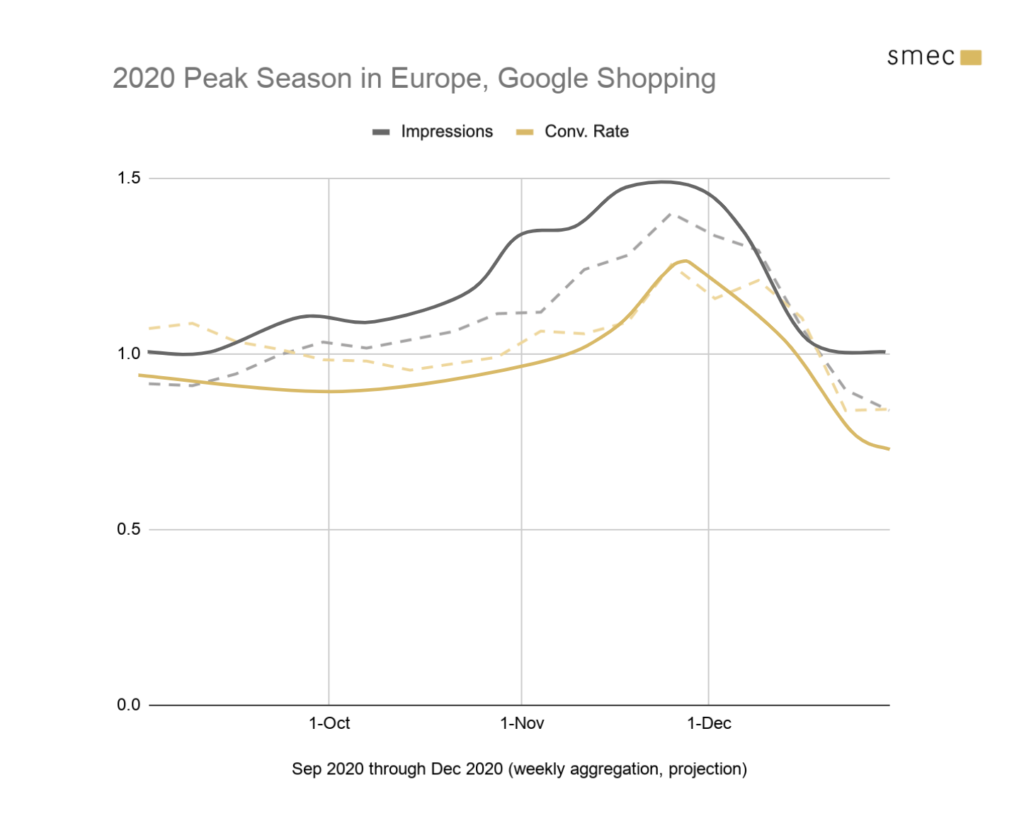
In this chart, I’ve taken the actual 2019 data (dashed lines) and layered on sketches of how I think it might look in 2020 (solid lines). Let’s talk through it.
In 2020, we are likely to start the season with already elevated impressions and already depressed conversion rates. As of July, impression and click volume are up about 32% YoY but conversion rate is down 5%. Facing this gap as a starting point means that meeting campaign efficiency targets and channel profit targets could be tougher in Google Shopping than last year, even though top line revenue should be high. It’s a question of how wide or narrow that gap will be during core marketing weeks.
A big question mark for me: what about Black Friday here in Europe?
Generally I am not a fan of Black Friday and I find it unfortunate that it spread from the US to Europe. There is no guarantee that a mass shopping event like this delivers incremental revenue or drives brand loyalty. Instead, it consolidates a huge amount of demand into a narrow, highly competitive timeframe that puts pressure on pricing and logistics, resulting in lower margin for the industry.
I could imagine that Black Friday will be a bit flatter this year for a few reasons:
- demographics: the huge numbers of new online shoppers might have a lower awareness of Black Friday and their shopping patterns would be agnostic to it
- health: packing physical stores with Black Friday crowds is a no-go, so some retailers might choose to de-prioritize the event compared to last year
- Amazon: Prime Day is now rumored to occur on October 26, and this plus “early Black Friday” promos running through November could draw demand earlier
- supply chains: as mentioned, Black Friday is always a stress test for logistics networks, which this year could result in stockouts or shipment delays that challenge the event
Instead of a Black Friday-dominated season, I expect that we will see a broader peak that starts and ends earlier than usual. But we will just have to wait and see.
Final word
We cannot know what will occur during Q4. Public health and policy will remain huge variables. My prediction is that we’ll see huge volume with core targeting challenges. With that in mind, I recommend the following action items:
- Use query targeting to appear in the right auctions
- Build your audience lists now / get them in tip-top shape
- Device-specific bidding is a must
- Ensure your feed is up-to-date with useful attributes
- Also, deploy custom labels strategically (e.g. to define margin clusters)
- Opt in to Showcase Shopping to make the most of the high funnel
- Switch to DDA sooner rather than later (purchasing paths could be extra long)
- Avoid getting limited by budget: don’t miss demand
- Use auction insights to observe your competitive landscape
- Additional checklists here and here
source on Google →