Subscribe to join thousands of other ecommerce experts
Google’s long-awaited Performance Max Channel Report is finally here! Well. Almost. Currently in beta and rolling out to a limited set of advertisers, this new feature marks a major step forward in bringing much-needed transparency to PMax.
For years, advertisers have been asking: Where’s my budget going?
Now, there’s finally an answer! And this time, it’s more than smoke and mirrors.
But as with any new rollout, there are limitations. Some data is buried. Some metrics are still missing. And turning this raw visibility into meaningful analysis will take extra work.
In this post, we’ll unpack what the Channel Report delivers, where it falls short, and how to get even more out of it. So you’re ready to make the most of it when it hits your account.
Table of Contents
What the PMax Channel Report is (and how to access it)
The Performance Max Channel Performance Report is a new in-platform reporting feature currently being rolled out within Google Ads. It gives advertisers a view into where their PMax campaigns are serving—across major Google-owned surfaces.
Importantly, the PMax Channel Report is:
- It’s only accessible at the individual campaign level
- It’s not yet available account-wide or in the Report Editor
- It’s currently in limited beta, with broader rollout expected this year
To check whether your account has access, go to:
Campaign → Insights & Reports → Channel performance
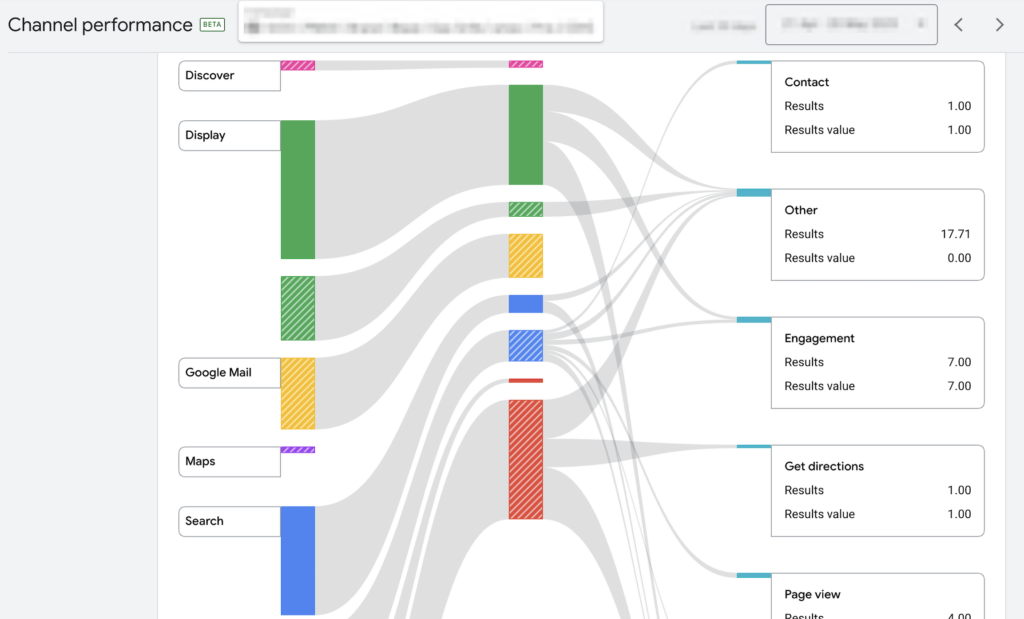
Inside, you’ll find a table-based report alongside a Sankey diagram. These views break down your campaign’s delivery across key surfaces like:
- Search – Includes both text ads and Shopping ads
- YouTube – In-stream video, Shorts, YouTube Discovery
- Display – Banners, Remarketing creatives
- Gmail – Teasers and expandable formats
- Maps with Ads – Local inventory placements
- Discover – Feed placements on mobile
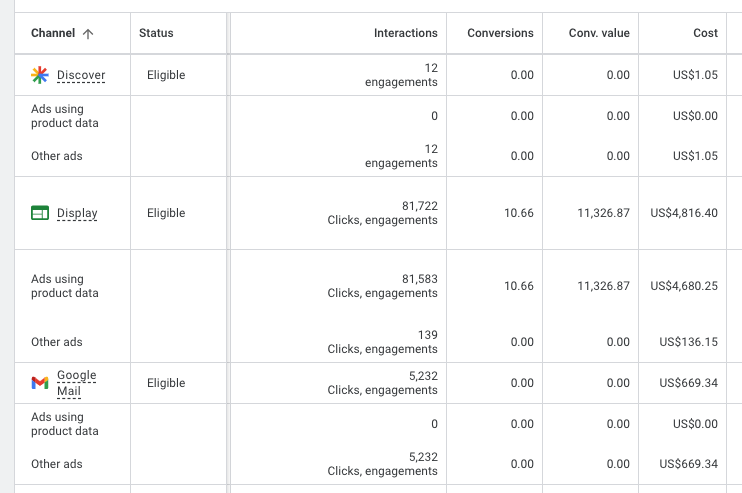
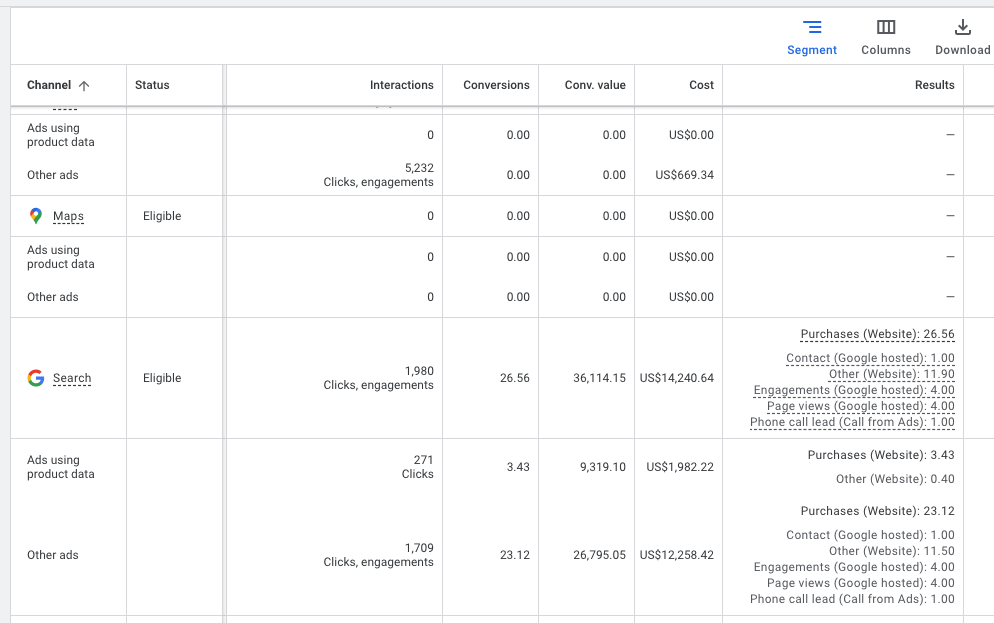
The table view shows metrics per channel:
- Impressions
- Interactions (e.g. clicks, views, or other engagement types depending on the format)
- Conversions
- Conversion value
- Cost
A standout feature: Google now splits each channel into feed-based and asset-based ad delivery. This gives advertisers a way to distinguish Shopping-driven formats from those built on creative assets—something we’ve never seen surfaced so clearly before in native PMax reporting.
That alone makes this report a significant upgrade. However, the report is still not without its quirks.
The PMax Channel Report is still not plug-and-play.
There’s no doubt about it: this report is a real step forward. But it’s still not a complete solution.
It offers transparency—but stops short of providing actionable insight out of the box. The structure is there, but it still takes some heavy lifting to extract performance answers, compare costs, and measure value efficiently.
1. Cost data: Available, but not center stage
Cost data is shown by default in the table view. But for a metric as critical as spend, it doesn’t receive much strategic emphasis in the PMax Channel Report’s dashboard.
- It’s not visualized in the Sankey diagram, which is more likely to catch the user’s attention.
- It appears alongside other basic metrics, but without performance context—like ROAS or value-per-click—that would help interpret it.
- There’s no option to sort or prioritize channels by cost impact within the UI.
So yes, cost is available in the table view, but you’ll only see raw spend. So in terms of user experience, it’s slightly de-prioritized by the interface, making it harder to act on directly from the dashboard.
2. Conversion categories: Hard to interpret, harder to trust
In the table view, Conversion results appear as dense, unsortable text blocks. This makes it difficult to make sense of the data at a glance.
- Conversion actions are listed together in multi-line cells, without the ability to filter or sort by type.
- You can’t isolate high-value actions (like purchases) from softer ones (like email signups) directly in the table.
If you’re trying to assess which channels actually drive valuable outcomes, expect to do some extra digging—or export and restructure the data yourself.
3. Still no channel-level ROAS or value metrics
Despite showing cost and conversion value side by side, the PMax Channel Report doesn’t calculate any efficiency metrics for you.
There’s no:
- ROAS (Return on Ad Spend)
- Value-per-Click
- Conversion Rate
- Cost-per-Click
These are standard KPIs in any serious performance workflow. While you can of course calculate them—if you export the data and run formulas yourself—none of these are shown in-platform.
PMax Channel Report: Demo
Interactions: Not as straightforward as they look
In the PMax Channel Report’s table view, you’ll find a column called “Interactions.” But the definition of what an interaction is exactly changes depending on the channel.
- Search and Shopping: Typically clicks
- YouTube: May include views (e.g. 10 seconds), clicks, or other video engagements
- Display and Gmail: Can include teaser expansions, swipes, or hover interactions
This matters. A spike in YouTube interactions might just reflect video views, not clicks. That inconsistency makes comparisons across channels tricky—and muddies the waters for performance evaluation.
You can calculate engagements manually by subtracting clicks from interactions—but again, that’s on you, not the interface.
Channel naming is vague and inconsistent
Let’s say you want to find out how much of your PMax delivery is happening via Shopping. Logically, you’d look for a row labeled “Shopping Ads,” right?

Shopping placements are grouped under “Search”—alongside traditional text ads and search partner traffic. Unless you already understand that feed-based = Shopping, it’s easy to misread what you’re seeing.
Here’s a simplified look at what Google’s channel labels actually mean:
| Search | Text ads, Shopping ads, Search partners |
| Display | GDN banners (Responsive Display Ads), Dynamic Remarketing/Prospecting |
| YouTube | In-stream, Shorts, YouTube Discovery |
| Gmail | Teaser previews, expanded email formats |
| Maps with Ads | Local search ads, sometimes tied to product feeds |
However, there’s:
- No toggle to separate formats
- No visibility into creative type or layout
- No guidance on which placements come from which asset group
Everything is bucketed at a high level—without nuance or actionable structure.
What the PMax Channel Report does right
Despite all of the above, the PMax Channel Report is the best concession Google has made to advertisers longing for transparency in PMax. In fact, it’s a strong starting point—if you know how to work around it.
✅ Directional clarity
You finally know which Google properties your ads are running on. That’s been a black box in PMax until now, and it opens up new opportunities for diagnosing overdelivery, identifying underperforming surfaces, and making smarter creative decisions.
✅ Feed-based vs. asset-based split
Each channel row is split into feed-based (product data) and asset-based (creatives and static ads). This lets you assess whether your campaign is relying more on Shopping-style delivery or creative-led formats—and where those are performing.
For retailers especially, this helps you gauge your true Shopping share, even if Google doesn’t label it as such.
✅ Export options unlock deeper insights
While the PMax Channel Report dashboard leaves some things to be desired, Google actually gives you more granular data when you export it. You can send the data to Google Sheets or download it as a CSV—quickly unlocking performance signals that aren’t visible in the UI.
Once exported, you can:
- Calculate ROAS, cost-per-conversion, value-per-click, and more
- Filter and isolate conversion types
- Compare performance across campaigns
- Feed clean, structured data into dashboards in Looker Studio or your BI tool
It’s not automatic—but it’s the cleanest and most flexible dataset we’ve seen from PMax so far.
What’s still missing
Again, these changes are a really big deal. Google is finally opening up its black box to give you a so far unprecedented level of transparency into PMax campaigns’ channel-wide visibility.
That’s exactly why it’s such a shame that Google stopped just short of making the PMax Channel Report an unabashed performance tool. For that to happen, it still needs:
- ROAS, value-per-click, and conversion rate
- Breakdown of interaction types by format
- Conversion filters by type and category
- Cross-campaign roll-up
- Toggle between feed-based vs. asset-based views
- Clearer labeling and placement logic
- Integration into Report Editor and API access
Until then, advertisers will continue to be stuck with partial views and manual patchwork.
That’s why we have been working tirelessly to give you a proper fix.
Here’s how to fix it!
To give you a TL;DR of how we see the current state of the PMax Channel Report: Potential—blocked by friction.
That’s why we’ve built a free tool that supercharges its capabilities.
🔗 smec Advanced PMax Channel Report.
A FREE script that transforms your exported PMax Channel Report into a fully usable, insightful dashboard. Here’s what it does:
- 🔢 Adds calculated columns like ROAS, CPC, value-per-click
- ✍️ Parses vague rows into intuitive Shopping vs. non-Shopping views
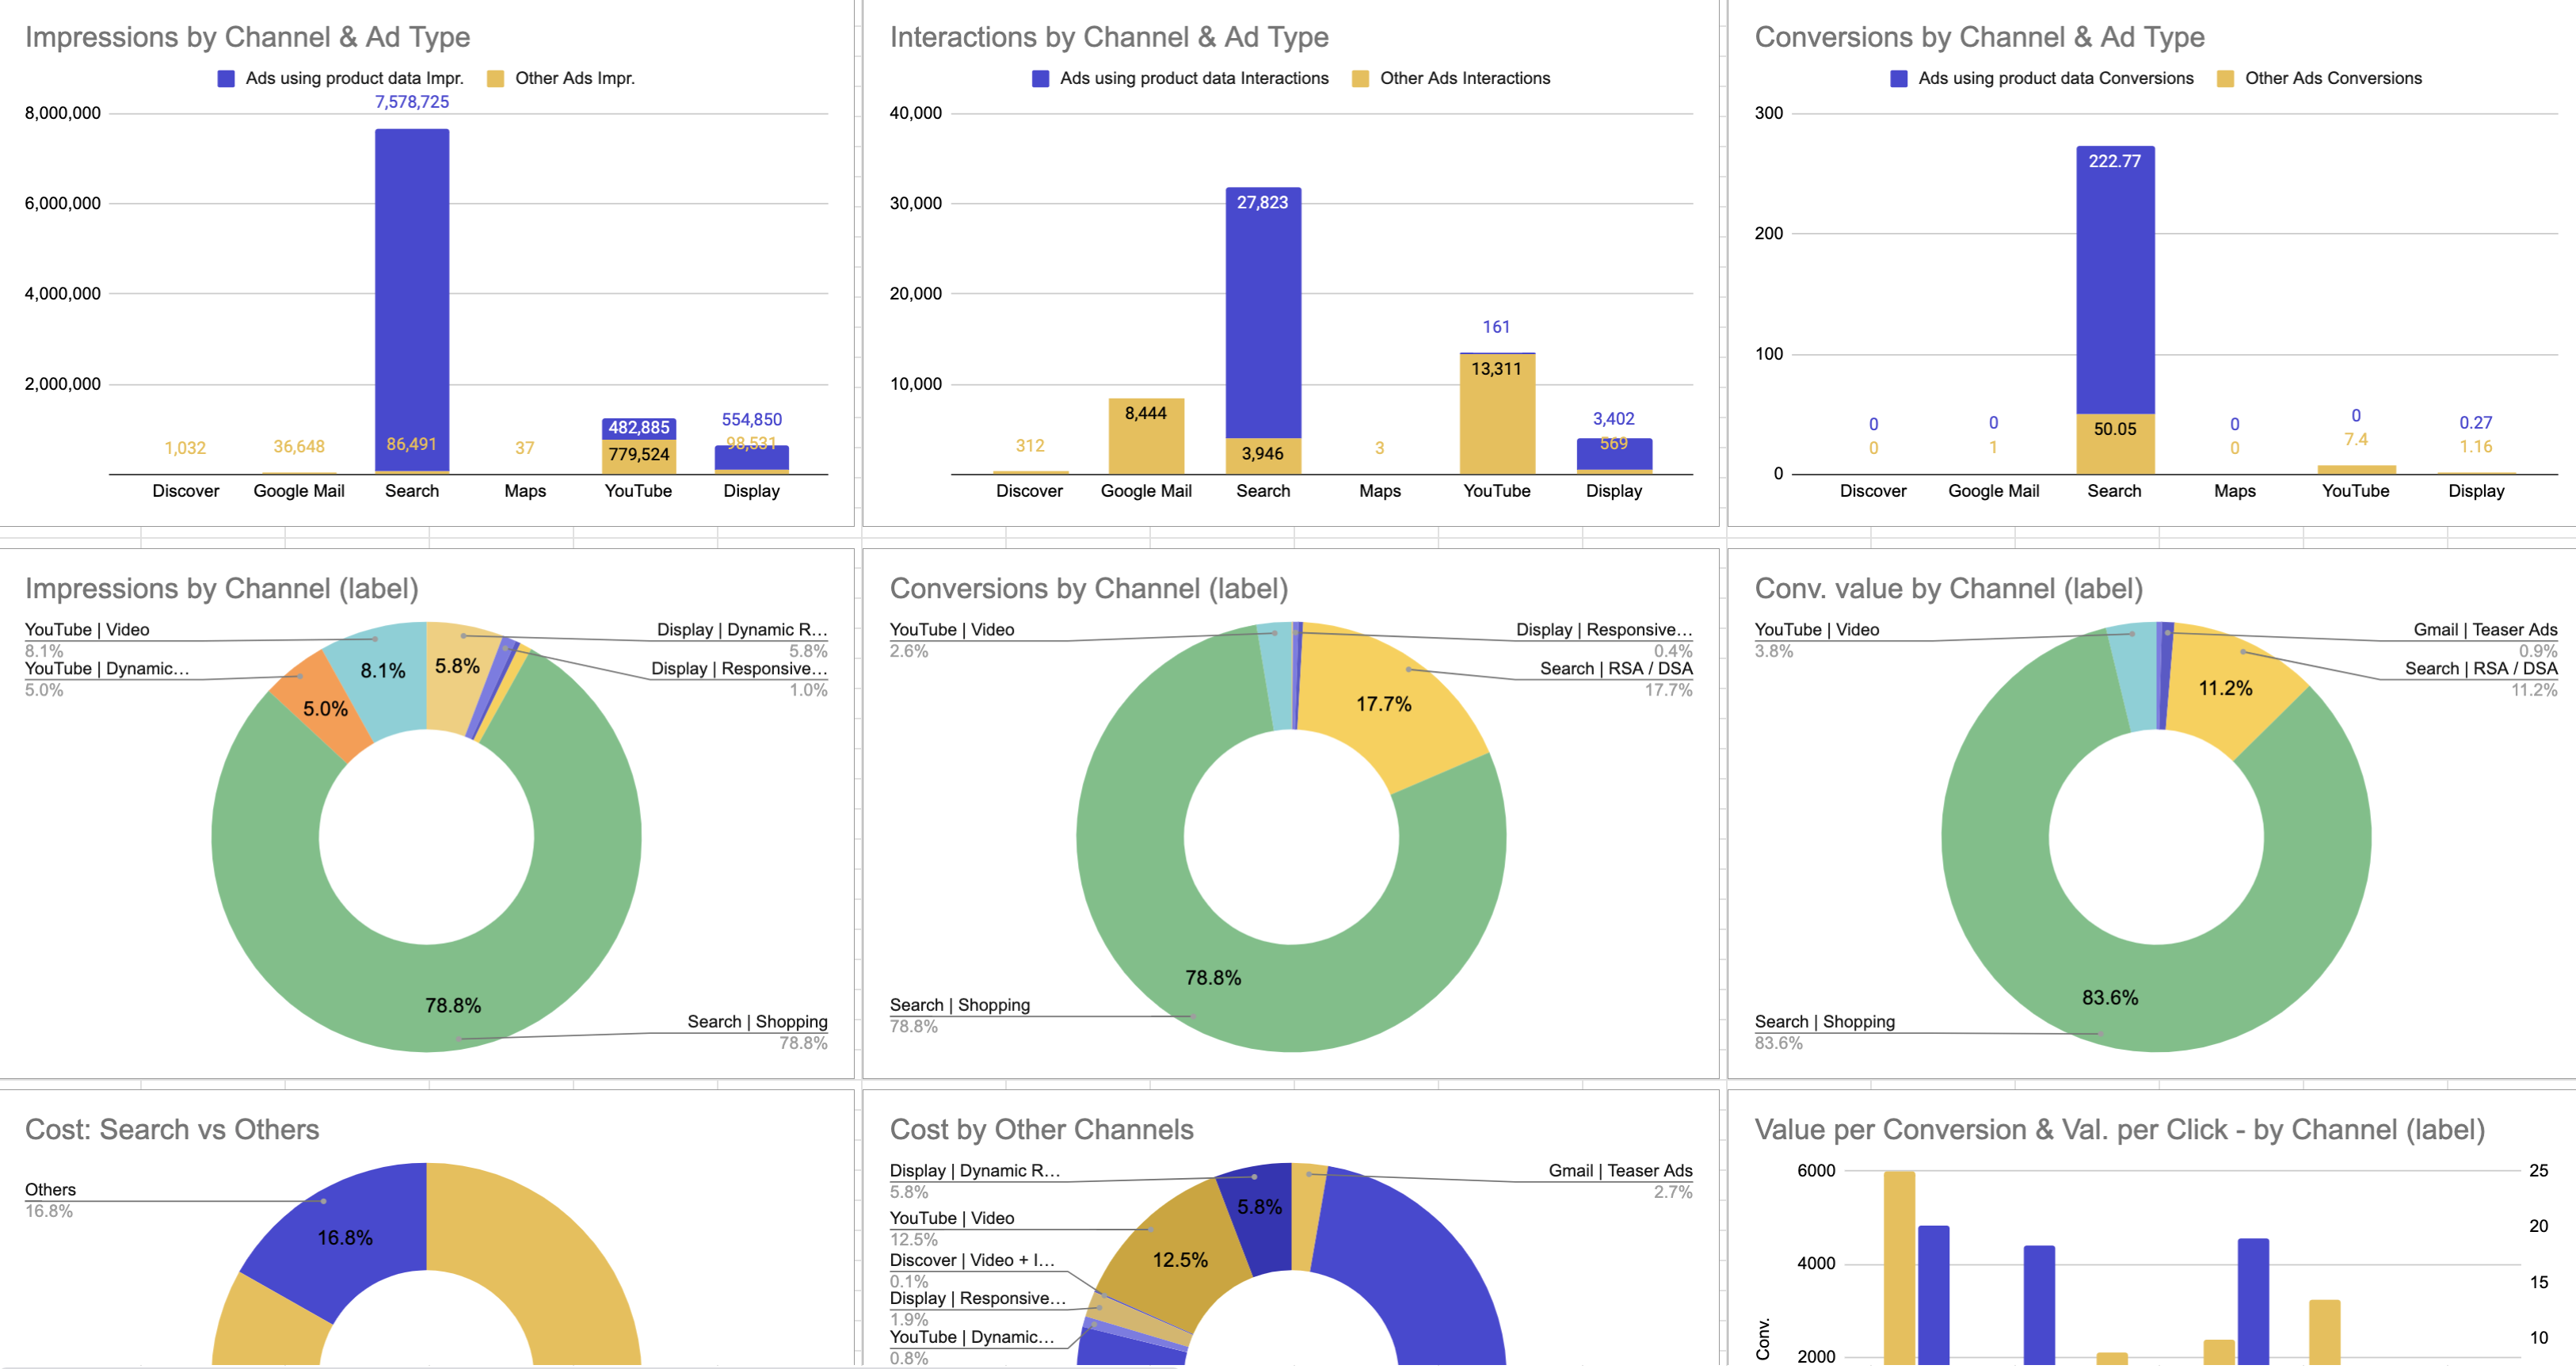
- 📊 Auto-generates clean visuals and breakdowns
- 🗂️ Gives you proper chart scaling and at-a-glance insights
No pivot tables. No formula hacks. No reformatting.
Just drop your exported Google Sheet’s URL into the script, and your messy channel data turns into a clean, usable dashboard.
🎯 Get the smec Advanced PMax Report!
No more tables and formulas. Just clarity!
👉 Get the free script!Because while Google gives you the data, you still deserve tools that make it actually work.
Final takeaway
This is a big move for Google—and a positive one.
The Performance Max Channel Report opens the door to visibility we didn’t have before. It gives advertisers a way to see where budget is going, how formats are being used, and what surfaces are driving results. That matters.
But it’s also just a starting point.
For now, you’ll need to do extra work to make this data useful. And if you want clarity, structure, and speed—you’ll need the right tools to get there.
Get the smec Advanced PMax Report now!
👉 CLICK HERE AND GET THE SCRIPT
Because advertisers deserve more than surface-level metrics.
You deserve performance data that actually performs.