Subscribe to join thousands of other ecommerce experts
The problem with focusing on classic Google Shopping click metrics like impressions, CPC, and CTR is that it can lead to tunnel vision for pay-per-click marketers. While such click metrics are as important as ever for measuring campaign performance, they do a poor job at measuring the alignment between your Google Shopping efforts and other core business objectives. To put it bluntly, at most companies the CEO, warehouse manager, or controller will not care that you increased CTR: they will want to know what this increased CTR actually achieved for the business or for their specific department. So how do you measure that? By integrating other business data into your Google Shopping campaigns.
This post will cover:
- How to integrate data via custom labels
- Use case: three inventory health metrics
- Insight into automating these processes
- A superb implementation we’ve seen
Table of Contents
Use custom labels to integrate operational data
Too often, operational metrics surrounding margin, holding costs, or inventory health are trapped in data silos separate from campaign performance metrics. Since the datasets do not speak to each other, it can be difficult or impossible to validate whether Google Shopping campaigns have a positive impact on other operational processes. In turn, investment clarity will be fuzzy from a bottom line perspective.
Luckily, Google Shopping is wide open to your data integrations via the custom labels attribute. You can add up to five custom labels to your product data, and because you control both the definition and the values, you’re able to use custom labels to inject basically any operational metrics you want. This is the perfect way to break through your data silos and deploy margin data or inventory data in your campaigns for better overall outcomes.
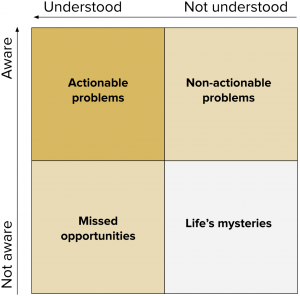
In this diagram, it’s clear your goal is to move problems into an area where you are both aware of them and understand them. Often there are operational pain points where you understand what action you could take from a pay-per-click standpoint, but your campaigns are effectively blind to the issue. Missed opportunities frequently include hidden champions or hidden slackers that are obscured by averaged or missing data. For example, you would know how to increase advertising pressure on products that are falling behind sales plan, if you had the specific problem awareness. Custom labels can bridge this data communication gap.
Google Shopping as an inventory management helper
To give some concrete examples of how you can use Google Shopping’s custom labels for better operational alignment, let’s take a look at inventory health. The question is often asked, “Can I use Google Shopping for inventory management?” – and the answer is a qualified yes. No, generally you would struggle to use Google Shopping to handle inventory shrink or backorders. But yes, if you pick your battles and set the right expectations, you’ll see that there’s a lot you can do to move the needle. Specifically, Google Shopping is a great way to address unhealthy inventory.
Some inventory problems, like overstock, are apparent, readily measured, and send clear pain signals to your purchasing, warehouse, and accounting departments. Much more threatening in my view are the inventory problems that fly under the radar. I’m talking about unhealthy inventory, which can be subtle, secret, or poorly understood – but on the whole leads to bloated and inefficient operations. This unhealthy inventory can’t exactly stand up and tell you what’s wrong. You need to give it a voice, or rather, a metric.
Here are three inventory management metrics you should consider integrating into Google Shopping:
- Sell-through rate
- Inventory turnover ratio
- Return rate

First, sell-through rate: this is an ideal metric for identifying if stock levels are falling out of sync with your sales plan. If you act quickly, you can help prevent overstock before it happens. For a basic example, let’s say your business has a sales plan to move 100 units of a given book this month. Now imagine you are 18 days into the month and have sold 25 units. This means you are 60% through the month, with only a 25% sell-through rate. Unless you have a promotion scheduled, you are behind plan: now is the time to bid more aggressively. By integrating sell-through rate into your product data via custom labels, you can create a structured and easily-automated mode of reacting – and even being proactive. Conversely, imagine if the same book were well ahead of plan: in that case you might demand a higher ROAS to maximize the strong sales.
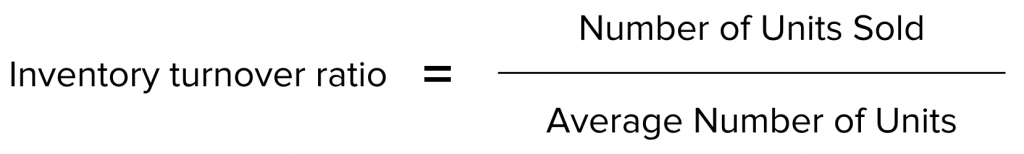
Inventory turnover ratio offers similar applications, but with a bigger picture in mind. This ratio helps you determine if a given product is earning its place on your shelves: basically, are the overhead costs healthy in relation to the sales volume? For a clear example, let’s say in Q1 of the calendar year you sold 100 TVs with an average stock of 10 units. The resulting turnover ratio of 10 would indicate a good brisk sales volume in relation to the costs and risk of stocking the TVs. Alternately, if you saw only 100 units sold against an average stock of 50, your ratio would suggest a lack of efficiency. You should touch base with your purchasing or warehousing teams, but there’s a good chance that such a low ratio indicates dying stock or other problems that you could alleviate by bidding more aggressively or lowering your return targets. In terms of isolated click metrics, it might sting to lower your ROAS demands – but since you’ve integrated other business data, you’ll know you are strategically pushing product that would otherwise damage your business’s bottom line.
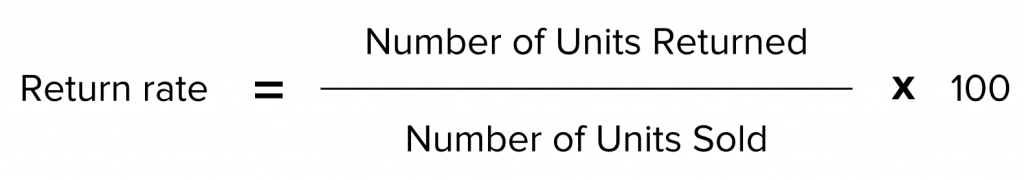
Return rate tells you how often a given product is coming back into your stock after selling it – an increasingly important metric as consumer expectations and behaviors shift due to the free returns offered by many platforms and individual merchants. Take fashion, for example, where many online consumers will order a product in multiple sizes, knowing from the outset that they will return whichever one doesn’t fit. For products with higher than average return rates, you will probably want to take a defensive position and expect higher returns on your ad spend. Custom labels can make this easily possible. You might identify products with greater than, say, 30% return rate as problematic for your margin. By labeling your inventory into different return rate tiers, you can aim for progressively higher targets in response to higher return frequency.
As we’ve mentioned elsewhere, custom labels are also extremely valuable for generating new insights and testing hypotheses, due to their ability to be reported over time. For example, your gut feeling might tell you that conversion rate drops as product age increases or when product availability (e.g. various sizes or colors) gets low. You could test and quantify these intuitions to create metered bidding behaviors. For example, a top-seller that receives a generous budget allocation could have its spend automatically throttled only when availability is low, since it won’t perform to its expected (budgeted) conversion rate.
Best practice: just automate it
We work with hundreds of merchants advertising via Google Ads, and most of them choose to automate data integrations like those mentioned above. With the right setup, automation offers resilient execution and precise goal-setting that entails very minimal effort. When evaluating a provider or considering homegrown or semi-automated processes, we recommend considering the following dimensions:
- Granularity
- Scalability
- Intelligence
- Control
Granularity is the ability to treat products as individuals in highly specific ways (a must to avoid averaged/blended data), while scalability is one of the central value propositions of automation – it’s your ability to target not just low hanging fruit, but to manage your entire assortment efficiently, regardless of size or volume. When it comes to intelligence, we propose a blend of machine and human effort: machine learning is great for ensuring statistical validity and reliability, while humans are best poised to deliver top-level strategic input as well as exception-based specialized treatment (i.e. insight driven rules like the cases mentioned above). This leads into the final facet – control. Whichever automated solution you deploy, please never accept a loss of control and never let your data get black-boxed. The problem with plug-and-play solutions like Google’s Smart Shopping (as one example) is that they take you out of the driver’s seat by minimizing your intervention possibilities. Automation should make your work easier, improve your results along multiple axes, and place you firmly in control with total transparency in terms of performance and investment.
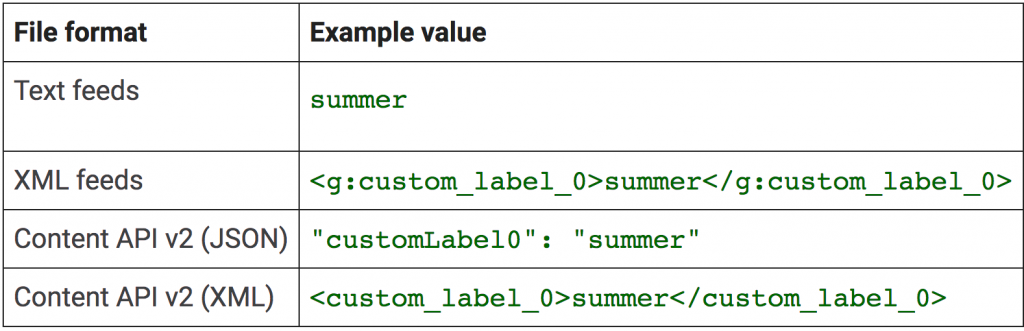
Custom label formatting examples, image courtesy of Google
Closing the loop: an example in automated data integration
The great thing about custom labels is that, because you can include up to five in your product data, you can also combine them. You can strategically mix integrated operational metrics in various ways to achieve highly advanced bidding strategies. One of my personal favorite examples comes from a top German retailer in the sporting goods segment. I’d love to specifically name this retailer, because they are doing an outstanding job – but instead I will keep them anonymous so you see a screen from directly inside their Whoop! account.
For context, this retailer advertises 30,000 products across 500 brands. They do this at the item level, meaning that every product receives unique treatment from our machine learning algorithm. They have chosen a goal metric called CRR, cost-revenue ratio. Also known as efficiency ratio, this metric is essentially inverse ROAS and is quite popular in the German market. Let’s take a look at their specific implementation.
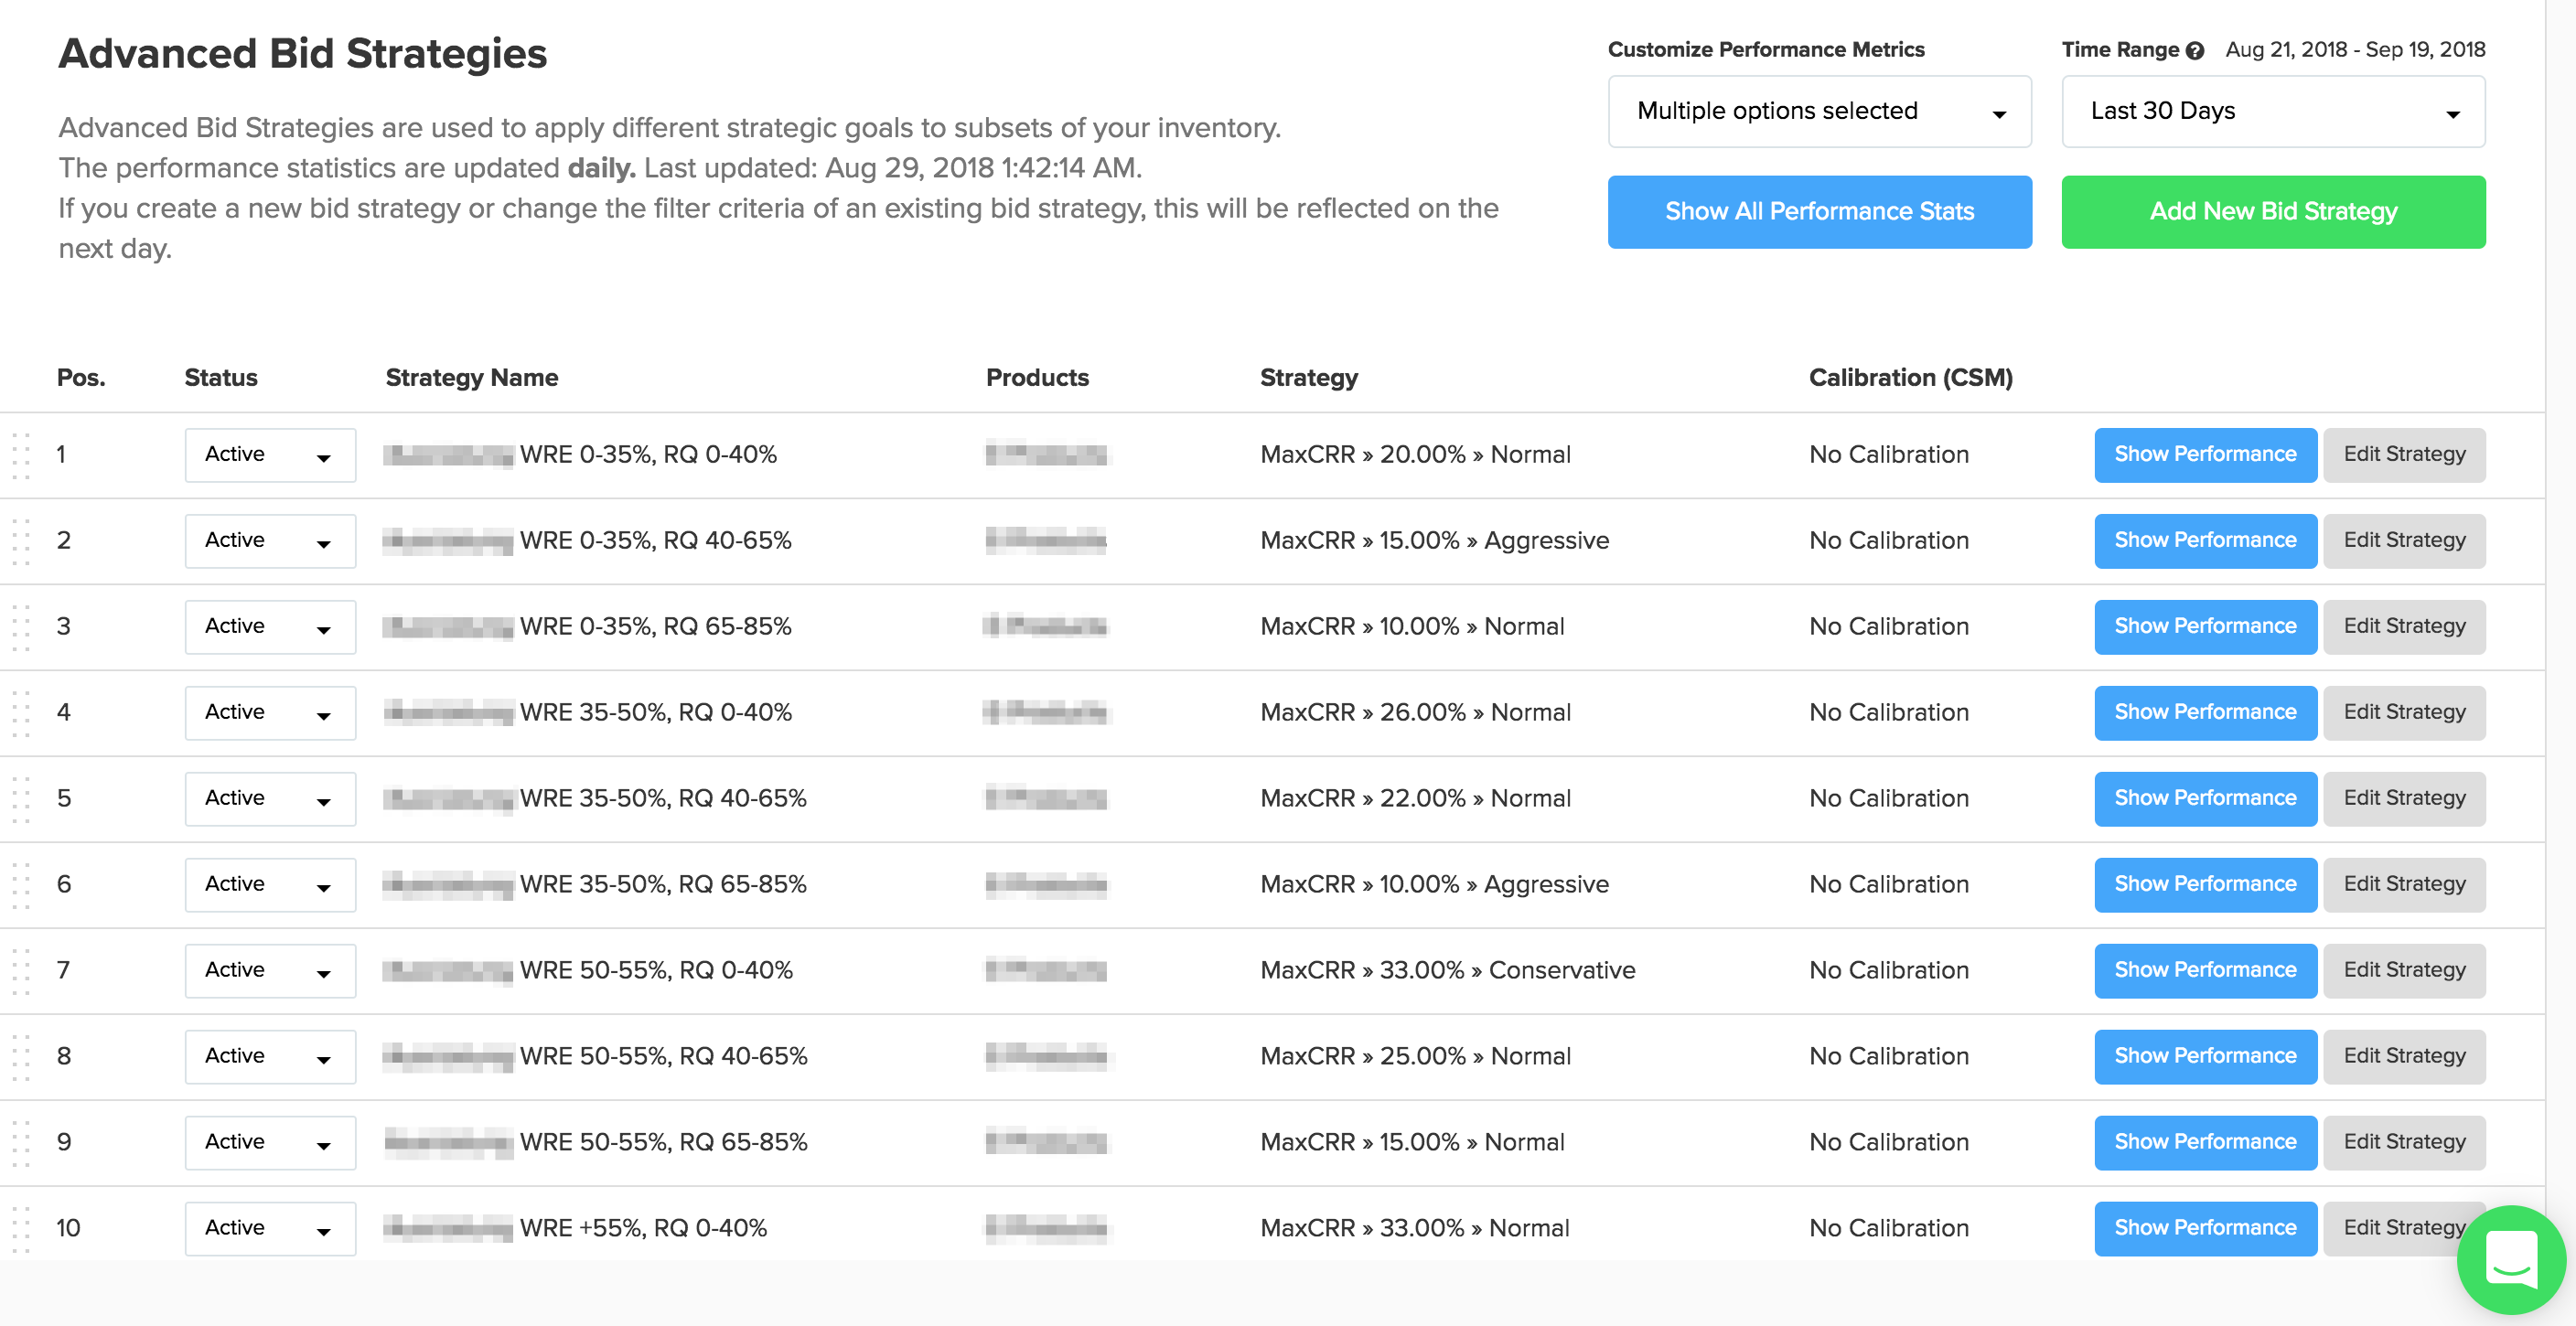
This retailer reaches efficiency targets using combined gross margin and return rate classes
What they’ve done here is to cluster their item-level bids into different goal tiers, where the goals are derived in relation to operational metrics: specifically, gross margin (“WRE” in German) and return rate (“RQ” in German). So, the segments are first grouped by margin, and then refined by return rate, with firm efficiency goals for each combination. In this way, spending is automatically more defensive for products with thin margin and high return frequency, while more profitable, less risky products can receive progressively more spend. As a final touch, by clicking the “Show Performance” button, the retailer can instantly access a range of KPIs for each of these segments.
This top sports retailer has successfully gone beyond click metrics, and the result is tight alignment between CPC, big-picture margin demands, and inventory behavior. This is a sophisticated example of an operationally-aware strategy conceived by humans and implemented automatically via a dashboard-controlled machine learning algorithm.
If your business could benefit from this level of clarity and control in your Google Shopping efforts, please reach out.