Subscribe to join thousands of other ecommerce experts
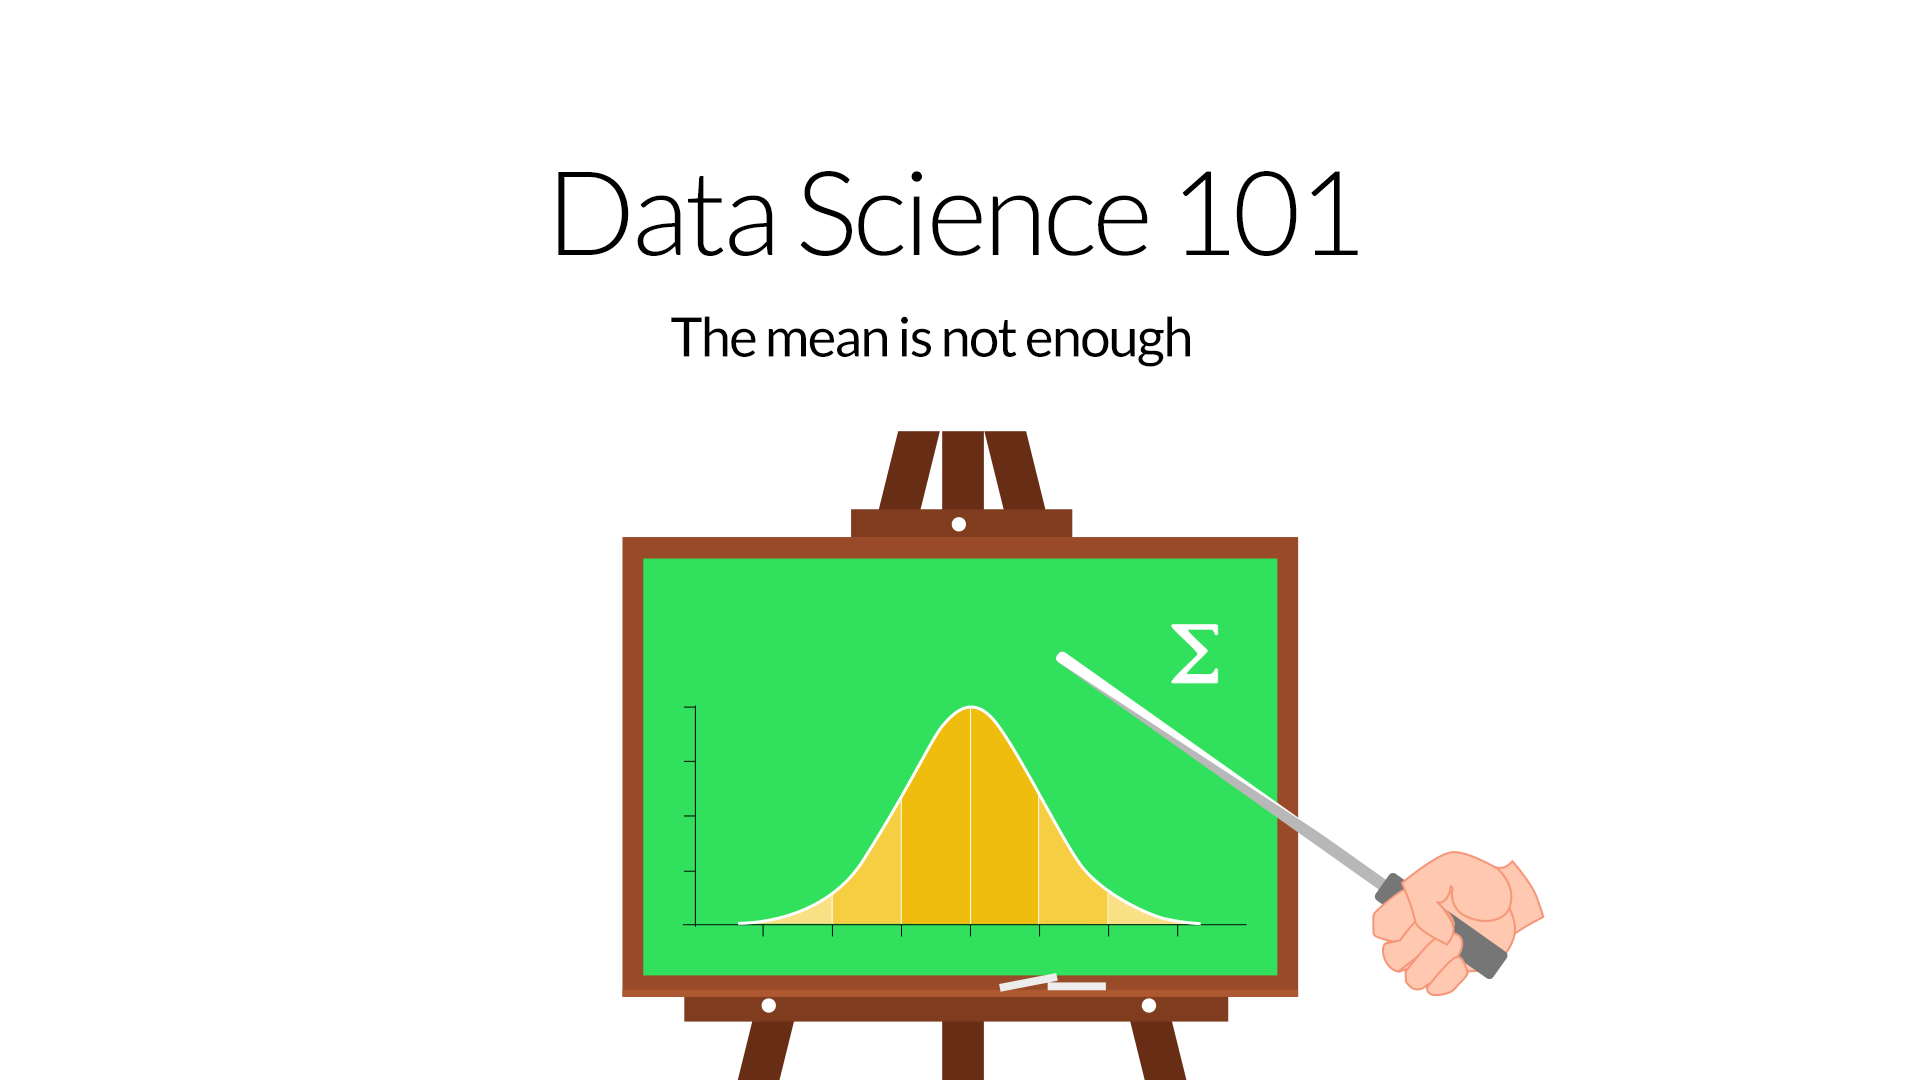
Data Science and PPC? Of course! There is no question that Data Science is getting more and more important when it comes to strategic decisions or an analytical view of PPC campaigns. In this blog post we give you some background knowledge about the mean (which is also used by Google in AdWords).
Too long, didn’t read version:
• The “Whoop!” Data Science team shared some statistics knowledge.
• Take advantage of our experience and read the most relevant information about the mean and outliers in this blog post.
• Use your new knowledge for monitoring your Google AdWords account.
Table of Contents
Motivation
Like mentioned, as Data Science and Statistics are getting more and more important, the “Whoop!” Data Science team shared useful information on how to get along with data and numbers. Two very interesting introducing lessons will be followed by an advanced course this year.

As the internal feedback was pretty good we want to post some of our top insights. This blogpost is about the mean.
Why the mean is not enough
Through averaging a lot of information is lost, but that is okay. Imagine to consolidate a lot, e.g. 500, numbers into a single number. Thus it is easy to understand that one value cannot represent every single original number correctly. This is what happens to your numbers on Google AdWords and therefore also Google Shopping.
For instance, say you sell three smartphones on the same day at the following prices: $ 99, $ 149 and $ 699. The average smartphone therefore costs $ 315,67. Take this second example: $ 299, $ 319 and $ 329 also results in a mean smartphone price of $ 315,67. You may know the mean in this context as the daily average order value.
Do you see the problem? The same mean can represent completely different data. Of course the same thing happens if you choose weekly or any other aggregation. We need some additional information to depict the variation of the values. We can calculate the so called variance and the standard deviation to give us the missing information. The variance is calculated as sum of the squared difference of each price minus the mean price, divided by the number of smartphones. The standard deviation is the square root of the variance1.
Our first example results in a standard deviation of $ 272 while the second example results in a standard deviation of $ 12.50. This result tells you that smartphone prices varies more in example 1 and are very close to the average price of $ 315.67 in example 2.
Outliers do impact the mean!
Think of the following example: There are 100 data points from 100 sold products. 99 of them are from your top seller and equals $ 50 and one is an outlier with $ 10 000. Thus the mean is $ 149.50. Now imagine that we interpret the numbers as income. Each of the 99 workers has an annual income of 50 k and the boss takes the whole profit at 10 million a year. You can read about stories like this in news everyday. Without further information in this case, 99% of the people guess they are underpaid compared to an average worker because a dramatic outlier influences the mean.
We can use a second measure which is insensitive to outliers and represents the other values better. It is called the median. To calculate the median, one has to order all values ascending or descending and take the value in the middle. This is called the median2. In our example the median value would be $ 50.
Guess what happens if the example company has a bad year and the profit of the boss falls to 500 k? The median is unchanged and still 50 k. The mean falls from 149.50 k to 54.50 k. The same thing can happen if your data set has input queries or the data quality is poor for whatever reason.
How does that connect to Google Adwords?
Now you can apply this knowledge while analyzing your Google AdWords and Shopping reports. Here is an example from a campaign where you can see the daily conversion values, eg. revenues:
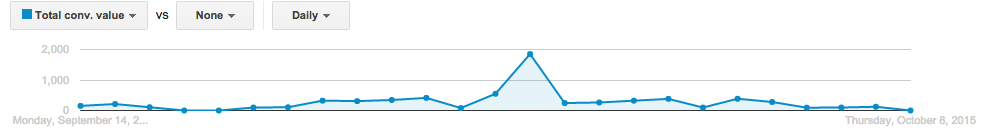
If you calculate the average order value over a time range, e.g. a monthly report, it would result in a mean far higher than usual daily conversion values. So if your boss asks which daily conversion values one can expect in the future you should be aware of the influence of outliers on an arithmetic mean and use the median.
Stay tuned for more interesting news from our “Whoop!” Data Science department!
References:
1 http://onlinestatbook.com/Online_Statistics_Education.pdf page 144ff
2 http://onlinestatbook.com/Online_Statistics_Education.pdf page 134ff
source on Google →