Subscribe to join thousands of other ecommerce experts
In 2024, the global economy will face unprecedented challenges and transformations. Inflationary pressures and fluctuating market conditions shape consumer spending habits worldwide. Price sensitivity has become more pronounced than ever before with people being increasingly more careful with their purchasing decisions.
Customers seek the best value for their money in a cost-conscious environment. To appeal to these budget-conscious consumers and remain competitive, online retailers need to reassess their pricing strategies. And as if that’s not already tricky enough, the power struggle between Chinese and Western ecommerce has further emphasized this need (hello, Temu!)
Is your pricing strategy ready for 2024’s twists and turns? Dive into our data-driven case study, powered by a machine learning model, and discover the pricing insights you need to thrive, not just survive.
You’ll learn how product pricing affects consumer behavior and how harnessing specialized technology based on your strategic business goals will enhance business performance in a price-sensitive market.
This introduction was updated to increase relevance.
Table of Contents
Bidding Automation & how to interpret prediction models
As part of our software solution for Google & Microsoft ads, we use machine learning to predict conversion rates for millions of products. On various devices, each and every day. In the field of machine learning, interpretability of models plays a crucial role, and so it does for us:
When making predictions on such a large scale, it is important to understand how those predictions are made. Insights into the decision making of the models build up trust in the forecasts – as long as they fit the general understanding of the prediction problem – and enable finding and resolving potential errors.
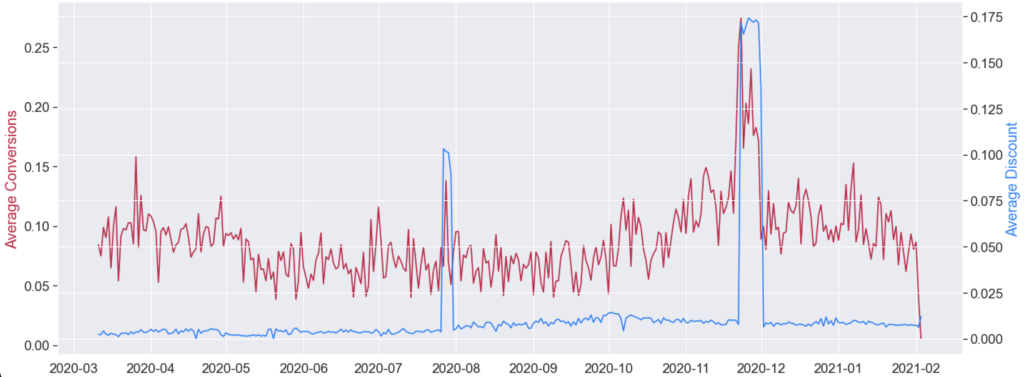
In certain practical applications, model insights, which illuminate how a model arrived at its predictions, can be even more valuable than the predictions themselves. Consider an example: During the pricing process, a retailer is particularly interested in understanding the link between product prices and conversion rates. A simple illustration (as below) might reveal that during a sale period, they can expect an increase in conversions. But to answer questions like “How does a 20% discount affect my conversion rates compared to a 10% discount?”, or “Do customers actually care about competitive pricing for brand XY?”, we need to use more profound techniques.
Throughout the remainder of this post, we will make use of such advanced methods and compute model insights using a tool called SHAP (SHapley Additive exPlanations), which is based on a game theoretic approach to explain the output of any machine learning model.
How conversion rate prediction models work
All of the following insights are based on anonymized, real-world data of one of our clients, which is also representative for other retailers.
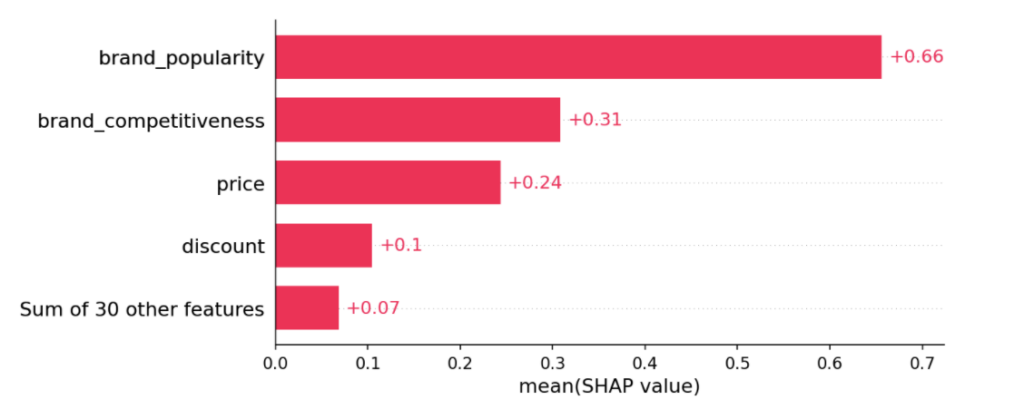
First up are feature importances, which show how important each feature in a machine learning model is for its predictions. For our conversion rate prediction model, four features are dominant:
The brand popularity, followed by three price-related features:
- Brand competitiveness: A measure of how competitive an item’s price is within items of the same brand
- Price: The price for which the product actually sells
- Discount: The discount for a sale item
Next, let’s take a closer look at the distribution of the feature impacts by plotting the SHAP values of every feature, color-coded by the feature value itself. We can interpret this as follows:
The average predicted conversion rate – which for our model is 3.5%, from now on referred to as base value – is represented as the grey line marked 0.00. Every feature pushes the output in a certain direction by a certain degree (represented by the horizontal scatter), depending on the feature value (represented by the color). For example, when brand popularity has a low value, the predicted conversion rate is driven down.
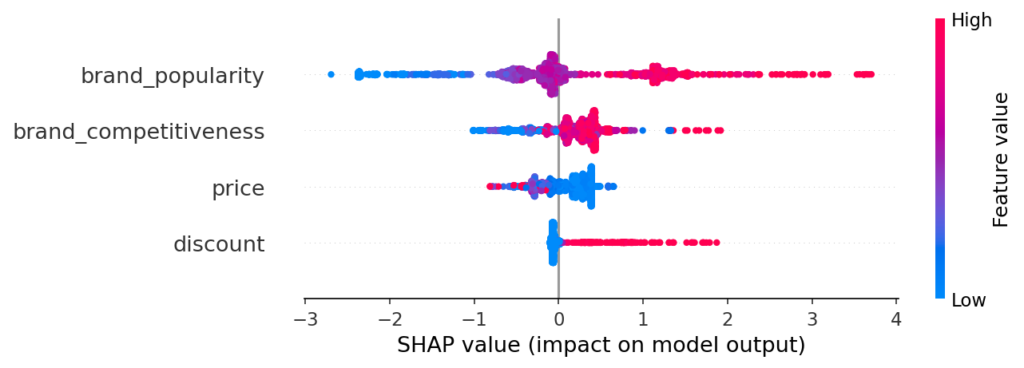
The above explanation not only confirms that the brand popularity is the most influential factor, but also illustrates that the model tends to predict higher conversion rates for popular brands – up to 4%! Contrary to that, conversion rates for unpopular brands are reduced by up to 2.5%, while the majority of brands are more or less neutral.
Moreover, the impact of brand competitiveness reveals that product prices are essential for forecasting: Competitively priced products have higher predicted conversion rates, while others are even punished by the model.
The price feature impact further confirms what we know from price elasticity: Low-priced items tend to increase demand (and therefore conversion rates), while a high price can have a negative impact.
Finally, we clearly see that a large discount can increase the conversion rate by up to 2%! That is a tremendous impact, compared to the average forecast of 3.5%.
How discounts and brand competitiveness depend on each other
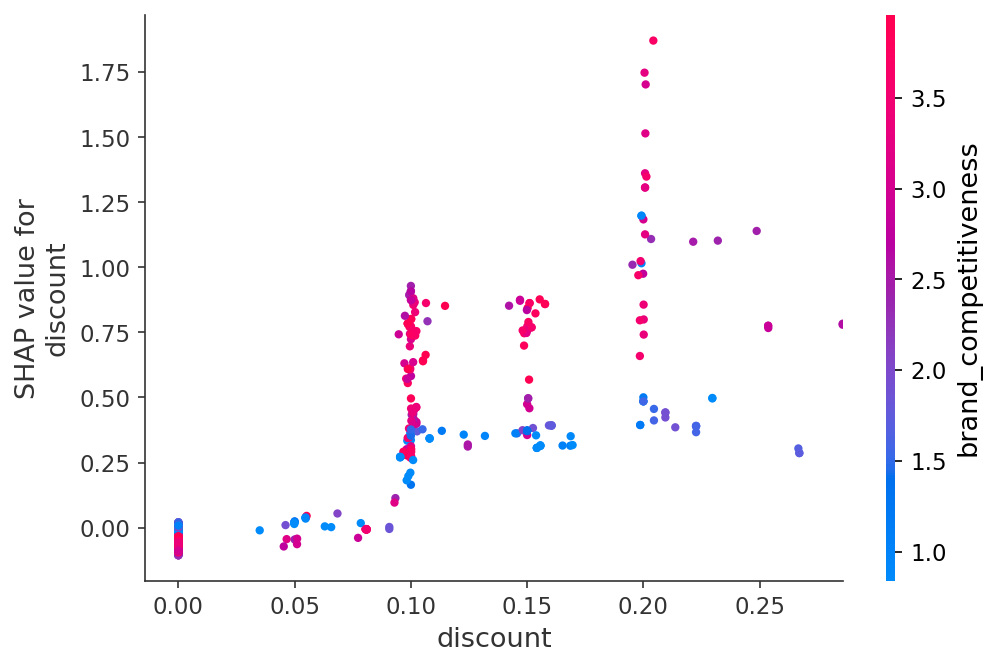
To understand how single features contribute to the model output, we plot the SHAP values of the feature as a function of the observed values of the feature in the dataset. The resulting dependence plot below highlights the change in predicted conversion rate as the discount increases: the higher the discount, the stronger the positive impact that feature has on predictions.
Vertical dispersion indicates interaction effects with other features, in this case competitiveness brand: If a product comes with a high discount, and the resulting sale price is competitive within its brand, the impact is the largest.
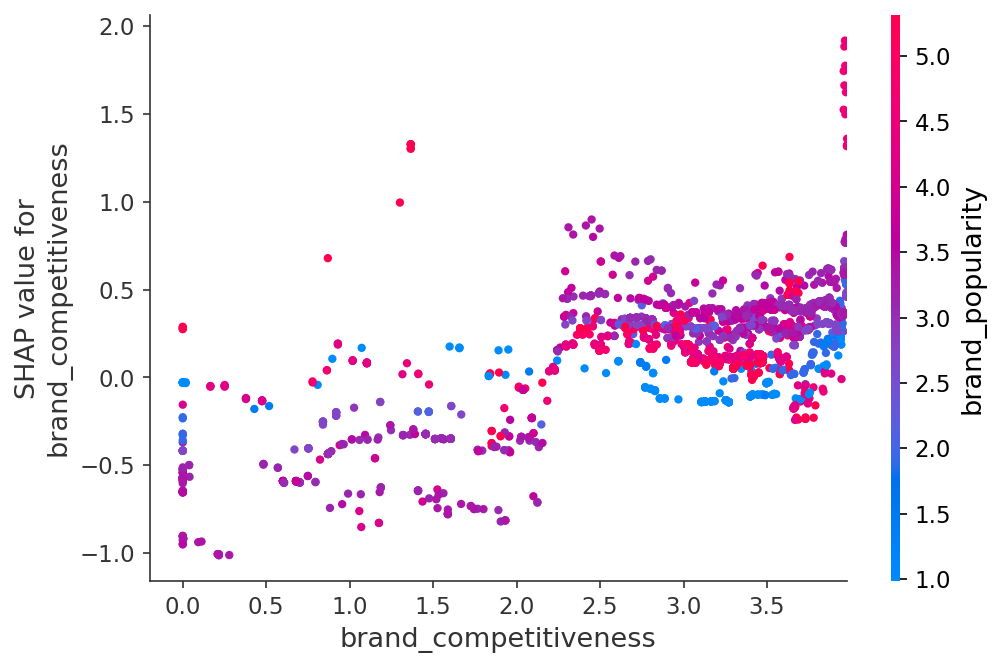
How competitive pricing influences conversion rates
A detailed look at the next feature indicates that competitive pricing for highly popular brands can boost conversion rate predictions by up to 2%. The difference is not as pronounced for the less-competitive brands, whose performance might instead be lifted by other features beyond the scope of this analysis. Moreover, for products which are not competitive (brand_competitiveness < 2), we see a reversal of the impact and predictions are lowered by up to 1%.
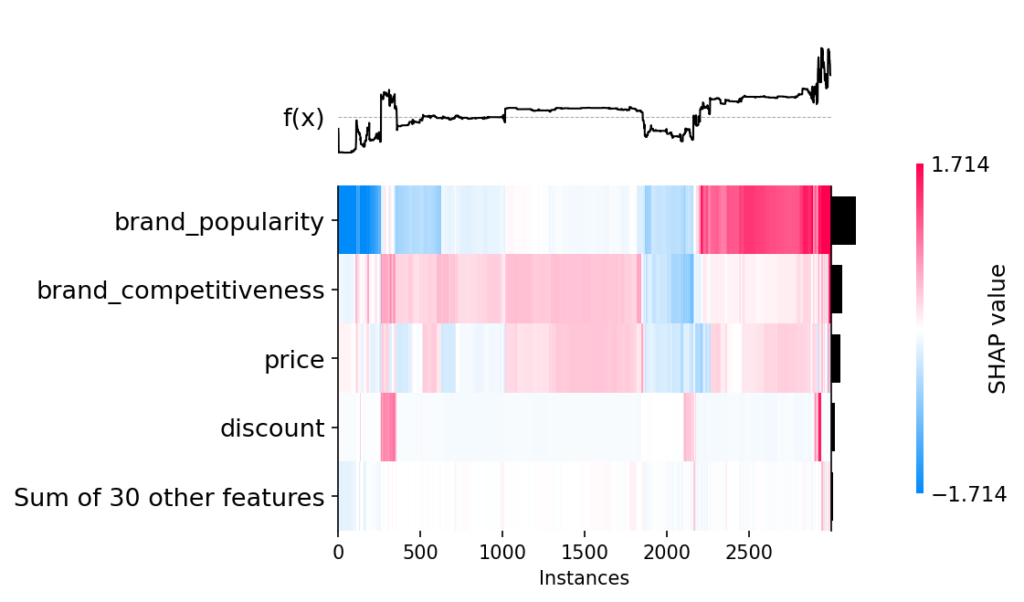
A global view on predictions
The next plot provides a compact overview of how the machine learning model comes up with its predictions. The predictions themselves are displayed above the heatmap, again centered around the base value (the horizontal line). The samples are ordered by their explanation similarity, meaning that instances having a similar output for the same reason are grouped together.
How to interpret the insights:
The model predicts a low conversion rate, if
- A product belongs to a very unpopular brand, or
- A product belongs to an (almost) neutral brand and is not competitively priced
Contrary to that, the model predicts a high conversion rate, if
- A product belongs to a popular brand, or
- A product belongs to a neutral brand, is competitive and comes with a discount
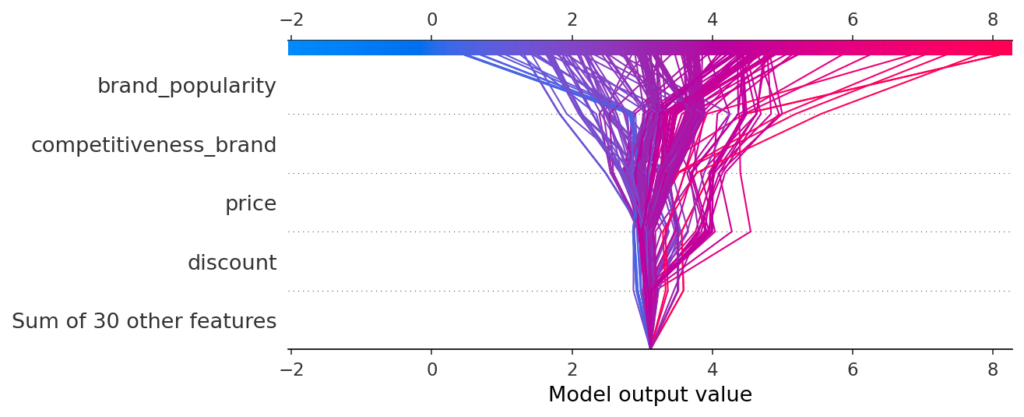
How decision plots help to explain model predictions
A decision plot is another approach to explaining how models arrive at their predictions.
The x-axis represents the model’s predictions, centered at the expected (base) value, and the y-axis lists all features by descending importance. Such a plot is to be read from the bottom to the top. Here, each prediction is represented by a line. It reveals how each feature contributes to the overall prediction, and confirms what we have seen already: A discount can boost the conversion rate for certain items, while the price and competitiveness split up the predictions into further paths, before the brand popularity determines the final output value:
Conclusion
The findings revealed by these model insights are consistent with our intuitive expectations: Conversion rates are likely to be higher for popular brands, and discounts also have a positive impact. This is a very good sign, as it means we can build up trust in the machine learning model. Moreover, the case study revealed that prices play a crucial role in predicting conversion rates, as competitive products undoubtedly perform better than others.
While the order of the feature importances can vary depending on industry, typically the same characteristics are always decisive for the predictions. If you are curious about the impact competitor prices might have on your products’ performance metrics, keep an eye on our blog. Our e-commerce and data science experts offer insights based on thorough research into the topic. And if you are generally interested in this domain, consider exploring smec’s technologies which use data & automation to better control ad platform algorithms with superior data inputs, such as pricing data. We help online retailers enhance business performance, based on their business goals.
For more information about how you can leverage pricing data and cope with ever increasing competitive pressure, read our deep dive on data-driven pricing.
References:
- Lundberg, Scott, and Su-In Lee. “A unified approach to interpreting model predictions.” arXiv preprint arXiv:1705.07874 (2017).
- Lundberg, Scott M., et al. “From local explanations to global understanding with explainable AI for trees.” Nature machine intelligence 2.1 (2020): 56-67.
- 3. Lundberg, Scott M., et al. “Explainable machine-learning predictions for the prevention of hypoxaemia during surgery.” Nature biomedical engineering 2.10 (2018): 749-760.
Podcast:
To help you go deeper into the topic and learn about pricing strategies that make a difference, we invited Max Hallerstede, CEO of Hallerstede GmbH, to our “Growing Ecommerce” Podcast. Hallerstede GmbH is a long-running family business in Germany that Max helped bring online under the ecommerce trading brand Kofferworld. What’s so special is that Max is a real pro in logistics, purchasing, and pricing.
source on Google →