Subscribe to join thousands of other ecommerce experts
Just like our continuous support for ABS, we are fully committed to deliver additional value to our data visualisations for Whoop!. The first step was to introduce four powerful charts which we featured in our blog – click here to check them out.
Fast forward to today and our Product team created another batch of useful visualisations to provide you with even more insights regarding your brand performance.
What the new charts will offer:
Two informative new visualisations for Whoop!, which enable the user to have a deep look into their brand performance. To be more precise, these new additions allow to compare brands against each other and discover how they performed in a specific month/year:
- Brand Insights
- Brand Stacked Bar Chart
Table of Contents
Brand Insights
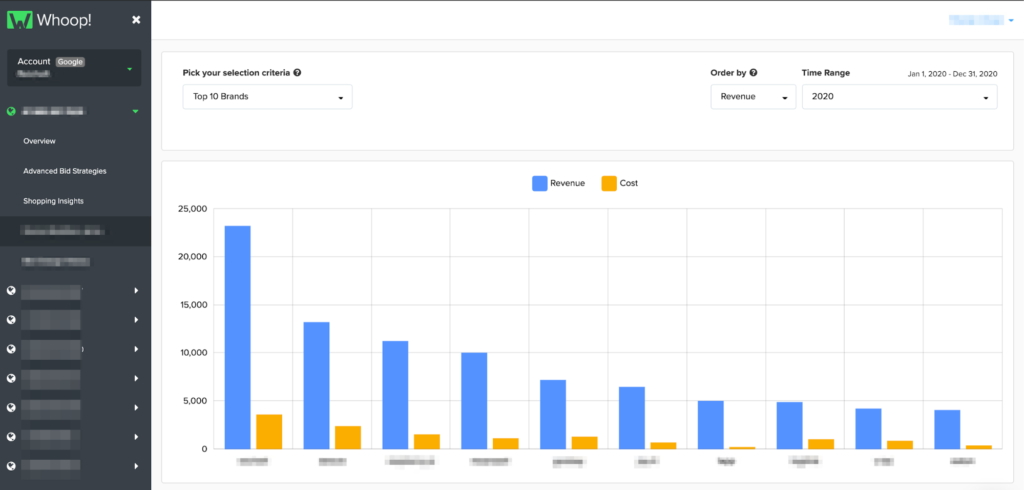
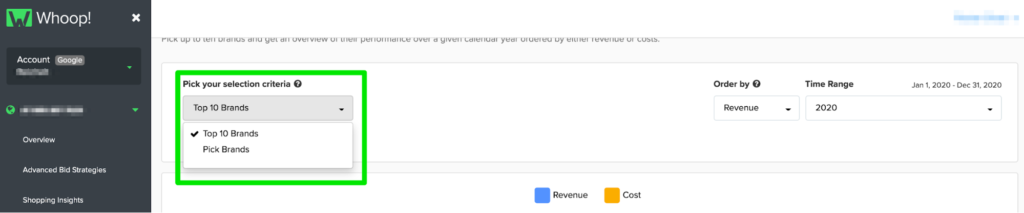
Pick up to ten brands and get an overview of their performance over a given calendar year ordered by either revenue or costs. You can either select your top ten brands or choose ten brands on your own.
That allows you to easily spot and compare the revenue and cost contribution of top performing brands or investigate smaller brands. Furthermore, just a couple of clicks are required on your part to visualise the difference between revenue and cost to see how well your brands performed in a certain calendar year.
In addition to the visualisation above you can scroll down to see a detailed listing of every selected brand and their KPIs:
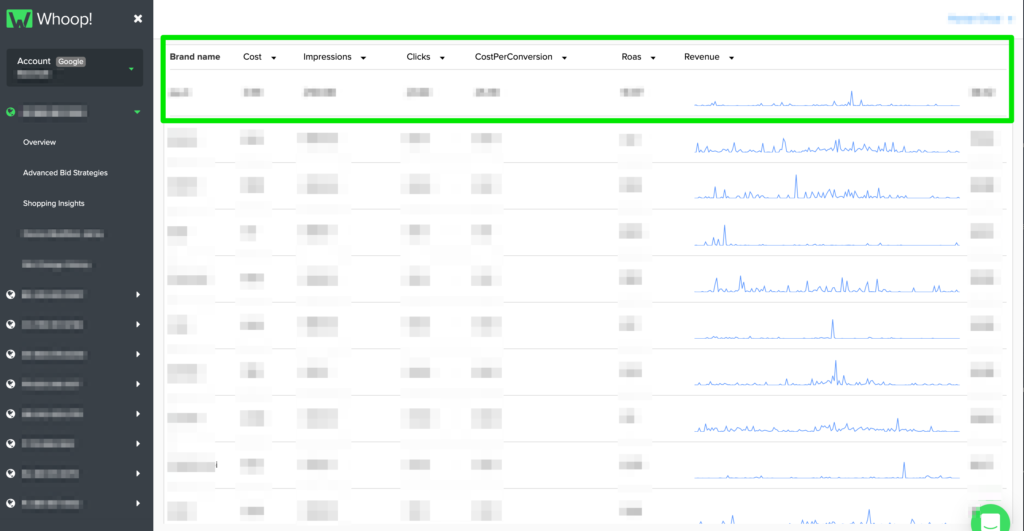
With this knowledge you can adapt your strategies by pushing certain brands even more or approach underperforming ones from a different angle – just a single glance is needed for spotting the difference between revenue and cost and therefore you can quickly determine where actions are required.
Here is a slice of some practical examples of how you could utilise this new visualisation:
- Which brand performed the best throughout the year?
- Which brand generated too many costs?
- Which brands need reevaluation of their strategy?
- Which brands could benefit from increased ad spend?
Brand Stacked Bar Chart
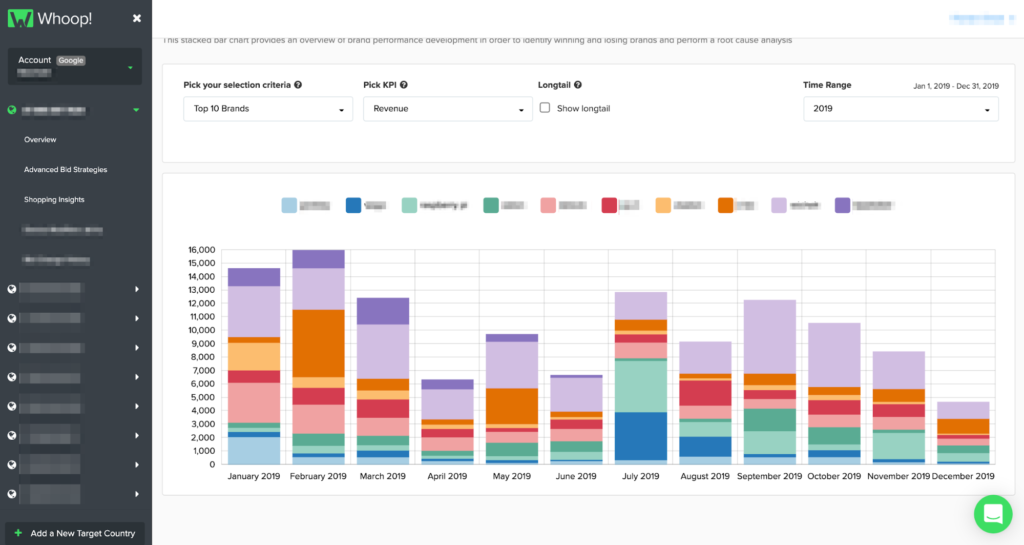
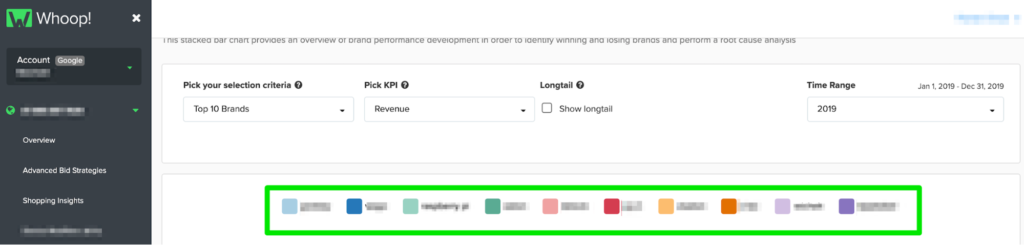
This stacked bar chart provides an overview of brand performance developments in a given month. As the name of the chart implies it “stacks” the different brands on top of each other and visualises the difference in performance for each month of your selected calendar year. Just like with the Brand Insights chart you can select either your top 10 brands or choose 10 to your liking. Each of the brands will receive a unique colour to visually separate them from the others and by clicking on them you can exclude brands from the visualisation:
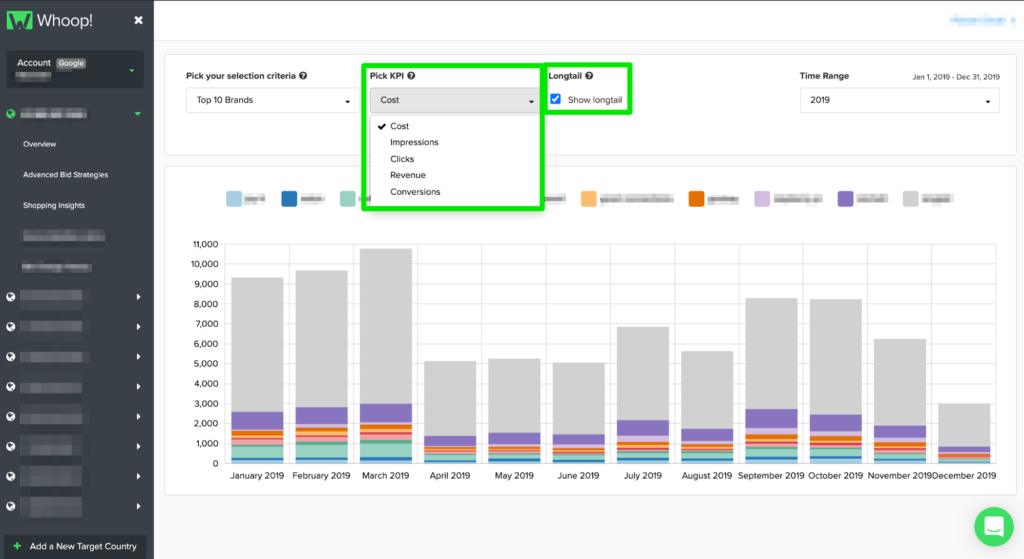
Using the Brand Stacked Bar Chart allows you to sort by a variety of different KPIs such as impressions, clicks, cost and conversions. Just pick what you need. In addition to that, you can visualise your longtail (all other brands) too which is represented as a grey bar as you can see in the image below:
Utilising these charts makes it very easy to spot your monthly developments in your brand performance. It’s also pretty handy to determine if a certain brand performs better or worse in a specific seasonal period. As mentioned above you can choose from a variety of different KPIs and visualise your longtail too.
Our Brand Stacked Bar Chart could help you answering following questions:
- Which brand performs best throughout the year?
- Which brand outperforms other brands?
- Which brand performs better in certain months than in others?
- What’s the difference in performance between my top brands and longtail?
Brand performance is crucial
Brands are important for any healthy businesses. To check in on their performance with a couple of simple clicks is crucial to determine which brands offer the most value and which brands don’t. These charts are not only practical for your team, but also a simple and effective way to show the brand performance to other stakeholders in your company.
From there you can use your newly gained insights to derive further actions which can result in a more efficient brand strategy overall. With Whoop!’s ABS you have a powerful tool already at your disposal to let your newly formulated strategies come to fruition.
Give these visualisations a try, they are incredibly handy and any Whoop! user can utilise them without any additional cost.
source on Google →