Subscribe to join thousands of other ecommerce experts
In the Google Shopping world, bid management for large product ranges is a time-consuming and complex task which can make-or-break marketing budgets and business targets. And that’s exactly the reason why so many retailers turn to automated bid-management solutions, such as Smarter Ecommerce’s Whoop!, which uses the power of Big Data and Machine Learning to perfect and automate this tricky task.
But creating such an AI-driven solution is a fascinating challenge in itself, and so today, I’m going to take you behind the scenes into how the data science team at smec combine domain expertise, targeted research and Machine Learning know-how to design, test, deploy and refine our bid management solution.
As I am about to provide lots of details for the AI-loving ecommercionados (yes, I invented that), you can head straight to the chapter that interests you most:
- Seeing the AI-based solution
- Finding nuggets of wisdom in the data
- Choosing and combining machine learning components
- Testing and going live (my next post, coming soon!)
However, if you’d like a full picture of how to solve such a fundamental PPC challenge, I highly suggest reading the full post.
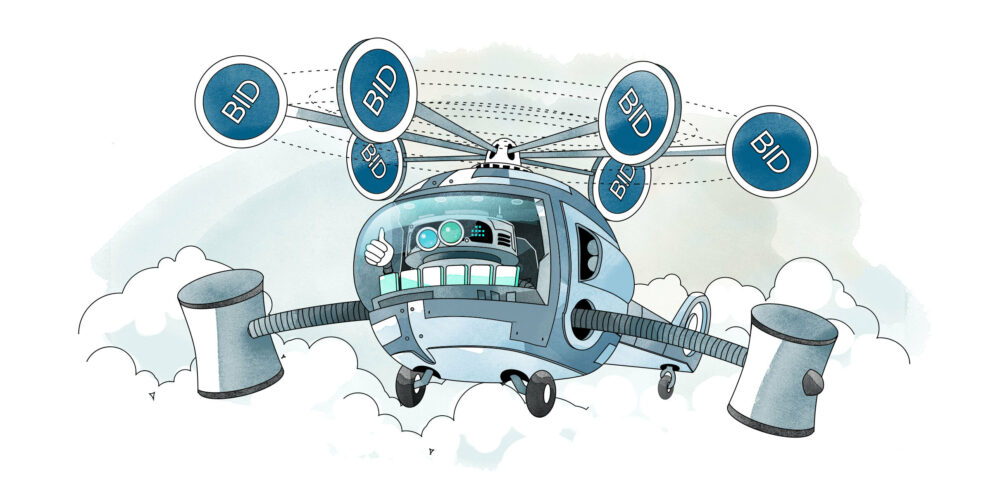
Seeing the AI-based solution
It all begins with thoroughly and clearly defining the business problem to be solved. In this case:
Many retailers have large and ever-changing inventories, and every item requires a unique bid reflecting its value to the business. These bids must be constantly adapted to suit any browsing device, at any time. And for maximum cost efficiency, all of this must happen automatically.
If you think that sounds complex, you’re right. Defining the perfect bids requires knowledge about many things: our clients’ Return on Ad Spend (ROAS) targets, market trends, future product performance and much more. Trends and future product performance are particularly challenging, given their volatility.
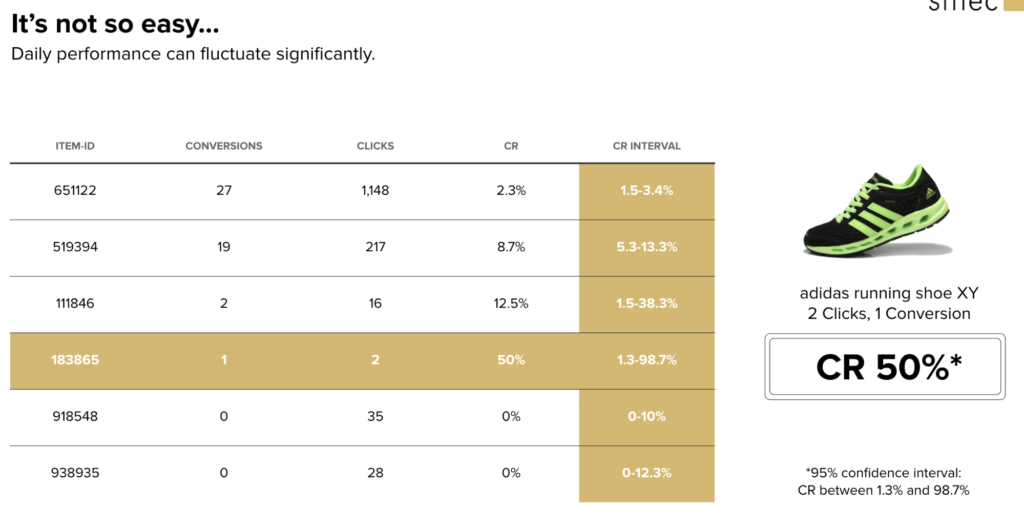
For example, the below table of hypothetical historical data includes a predicted conversion rate of 50%. But with only two clicks and one conversion for that product, the confidence intervals – the margins within which the prediction could actually fall based on this data – range from around 1% to 99%. That’s not useful at all! In fact of all the factors important for defining a bid, only the ROAS targets are known – and they change frequently, too.
Enter Artificial Intelligence. Specifically, Machine Learning is all about finding patterns in data which can be used to make a prediction. smec’s bidding model learns to predict various aspects of future product performance, based on patterns it finds in the customer inventory data and Google Shopping reports. The predicted metrics are fed into a carefully designed formula to generate recommended bids to Whoop!, our award-winning bid management solution. The result? Efficiency and granular, product-level control over the marketing budget, all leading to better performance.
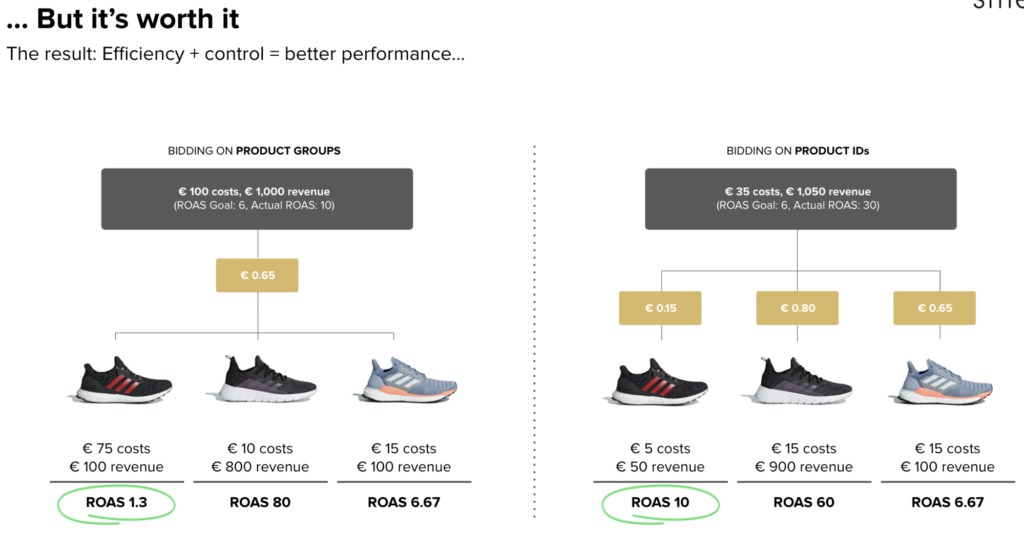
efficiency, control, and ultimately better performance
Finding nuggets of wisdom in the data
So we know we want to predict certain performance metrics which will be used to determine bids automatically. In order to train machine-learning models to make such predictions, it’s clear we will need past performance data.
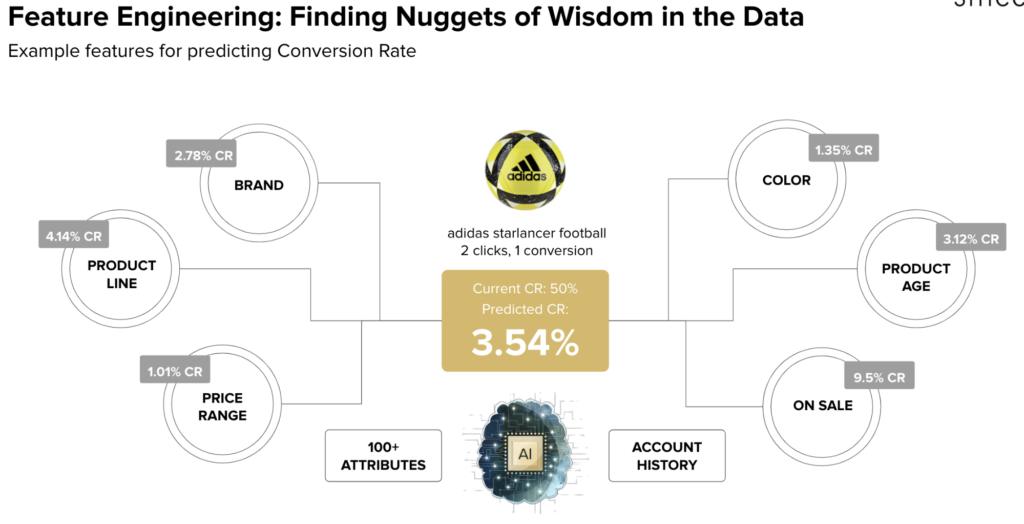
Additionally, we include information on the products themselves: characteristics like colour, material and brand. This gives us the unique benefit of being able to make accurate predictions for new products which have no performance data for the models to learn from. Of course, in the retail world, most products fall into this category.
But do we just throw all this data into the model and see what happens? Not quite. You see, our bidding models are constantly trained, in order to generate current, accurate bid predictions. Providing too much data would make the model unnecessarily complicated and prohibitively slow to train, while including information with no real impact on product performance – like GTIN – can even be harmful. And finally, simpler models along with model explainability techniques can yield better performance and real retail insights.
Thus, we need to convert the data into ‘features’: series of numeric and categorical values representing the most informative aspects of the catalog and performance data per product. This process, called ‘feature engineering’, is one of a data scientist’s most crucial tasks.
We propose potential features based on machine learning know-how and (company wide) domain expertise, and then verify their usefulness using rigorous testing and model explainability techniques, which reveal which features had the biggest impact on predictions. Our pipeline can even select the best features from those we provided, using different statistical methods.
Below we highlight the importance of using a rich feature set: remember the challenging conversion rate prediction earlier, where a new product didn’t have enough performance data to learn from? The solution is to include features describing the product’s characteristics, since those characteristics will have affected the performance of other products for which there is enough data. The model will learn to spot the similarities, and so be able to generalise to products it has never seen before:
a rich, informative feature set
Choosing and combining machine learning components
Machine learning is a huge field with many algorithms and implementation techniques. A good data science team must know about all of these, their strengths, weaknesses, requirements and appropriateness to a given task. One algorithm we have chosen to use also makes a great example for how machine learning works, so let’s take a look: the random forest regressor.
This algorithm actually works by running many instances of another algorithm, called a Decision Tree, and combining their results. A decision tree tries to learn a tree-like structure of simple decision rules from training data, which can be used to make predictions about future, unseen inputs.
Each rule tries to split the data points based on some feature, so that the resulting two groups are very different to each other but the items inside them are similar. It keeps doing this until each ‘branch’ consists of a single ‘leaf’ containing a small group of products whose performance is similar enough that a prediction can be made about them.
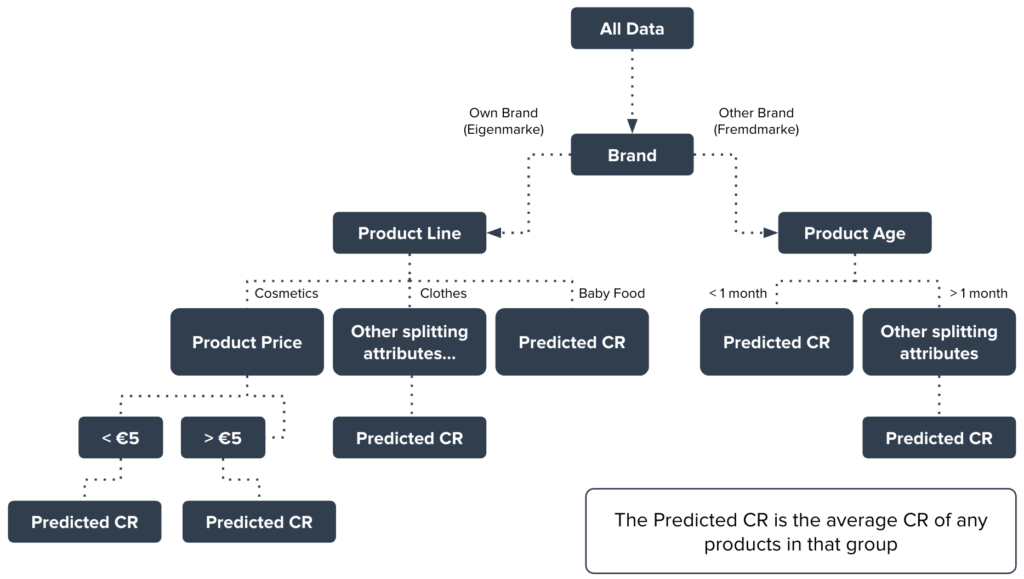
Below we illustrate this with the example of conversion rate prediction. Starting from the top, the algorithm takes all of the data and determines, statistically, that the first most informative way to split the data points is based on whether they are an own brand (Eigenmarke) or an other brand (Fremdmarke).
In other words, it discovers that ‘own brand’ and ‘other brand’ products have very different average conversion rates, but that the products within these two clusters have more similar conversion rates. In this hypothetical world, it appears that customers have different buying attitudes towards Eigenmarke and Fremdmarke products.
Following the ‘own brand’ branch, the algorithm finds that the most informative way to split those products is based on their product line: apparently our hypothetical customers also have different attitudes depending on whether the product belongs to cosmetics, clothing, or baby food. Let’s consider the ‘cosmetics’ branch. Here, the next best predictor of conversion rate is whether the product costs less or more than €5.
Perhaps our hypothetical customers often spontaneously add cheap cosmetics to their baskets, but are not so purchase-ready for more expensive items. At this point, the algorithm determines that there is no useful way to further split the products in the less-than-€5 group, and predicts the conversion rate as the average conversion rate for these products. Similarly, the average conversion rate for the more-than-€5 group is output as the prediction for that leaf.
For the sake of space, I won’t explain the rest of the decision tree. But take a look, and see whether you can interpret it yourself:
A random forest regressor fits tens or even hundreds of decision trees on random subsets of the data and available features, then uses their combined predictions to derive a more accurate, robust output.
Ensuring good performance requires systematically finding the best values for all ‘tunable’ aspects of the algorithm, such as number and size of trees, splitting criteria, data sampling process, and many more. This process, called ‘hyperparameter tuning’, requires significant machine learning expertise and thorough testing, making it one of the most important jobs for our data science team.
The random forest was chosen because it is highly accurate, works well with the kinds of big data we receive daily, and can be interpreted to gain real retail insights a human may not have been able to spot. But it is only one of the many machine learning techniques we use to drive the highest possible accuracy for each different client and situation. And in addition to machine learning techniques, clever pre- and post-processing of data and bids allow us to combine the best of artificial and human intelligence.
Next steps: testing and going live
We’ve come a long way by now. We envisioned an AI-based solution, carefully engineered the data to find its most informative aspects, selected the best machine learning algorithms and tuned them to perfection. It’s almost time to go live! Stay tuned for my next article, in which I’ll reveal our custom, three-step testing pipeline we use before deployment, and our work on continuous monitoring and improvement thereafter.
Check out part 2 of this article:
Testing the solution: AI-based bidding goes live in Google Shopping
source on Google →